
Computer Vision Data Drift - Why It's Important To Manage & How?

As the circumstances in which a computer vision model operates change, the model needs to be updated to ensure its adaptability.
For instance, consider a model used to identify objects in a retail store. As new products are introduced, store layouts are modified, and lighting conditions fluctuate, the model's performance may be affected.
Drift refers to the phenomenon where computer vision models gradually become less effective over time as the environmental factors and target objects undergo changes.
Evaluating data drift is crucial to maintaining the integrity of computer vision systems to prevent a decline in model performance.
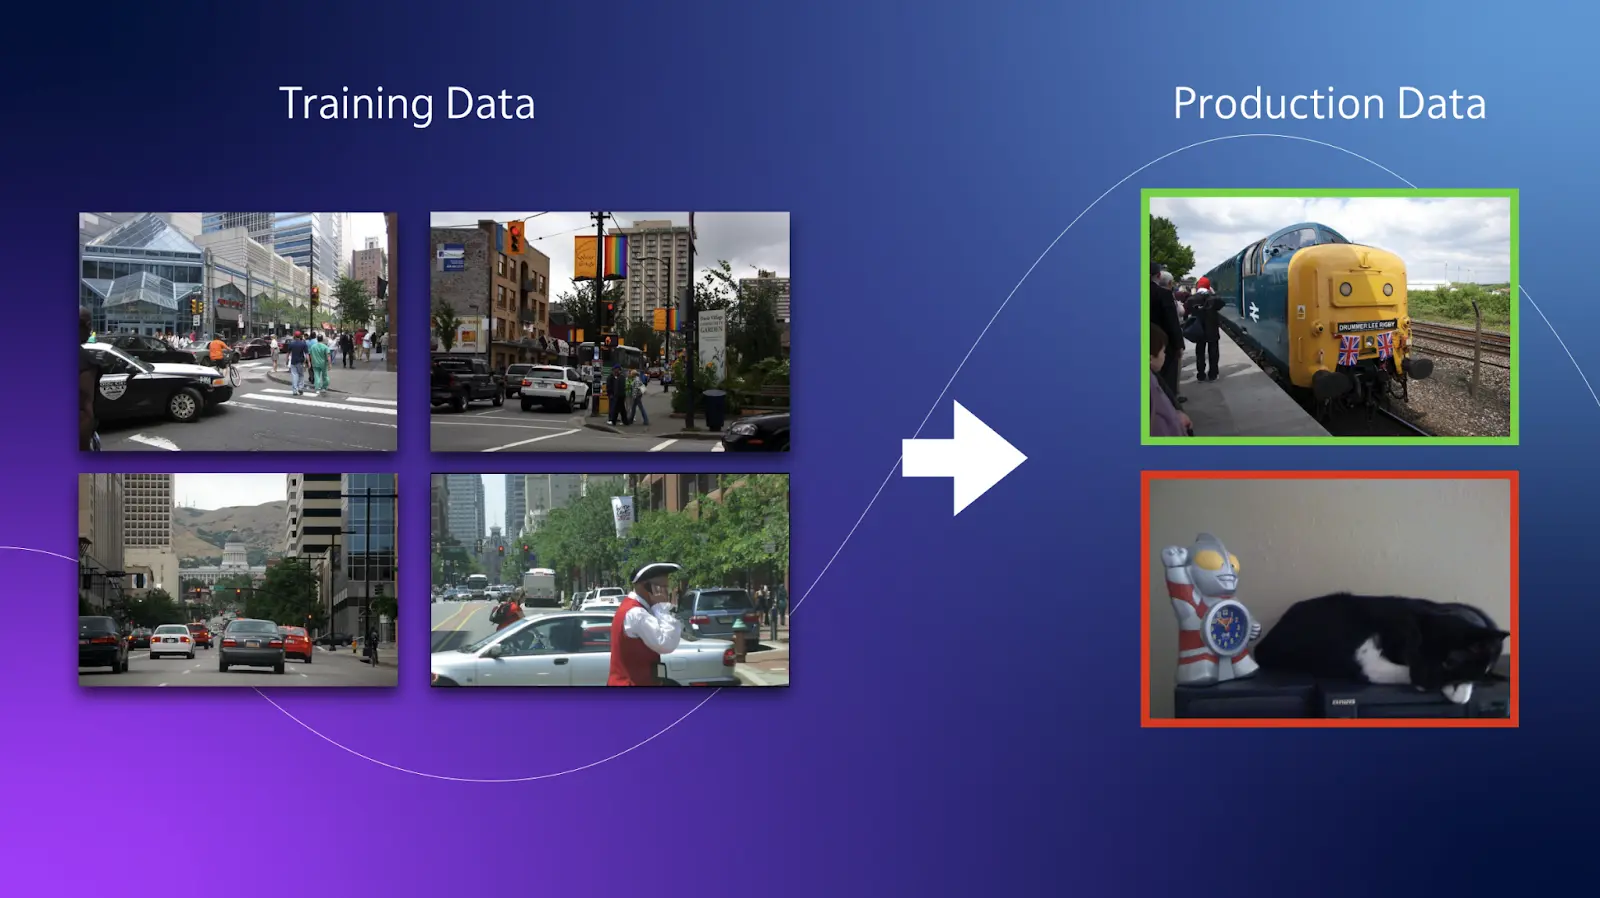
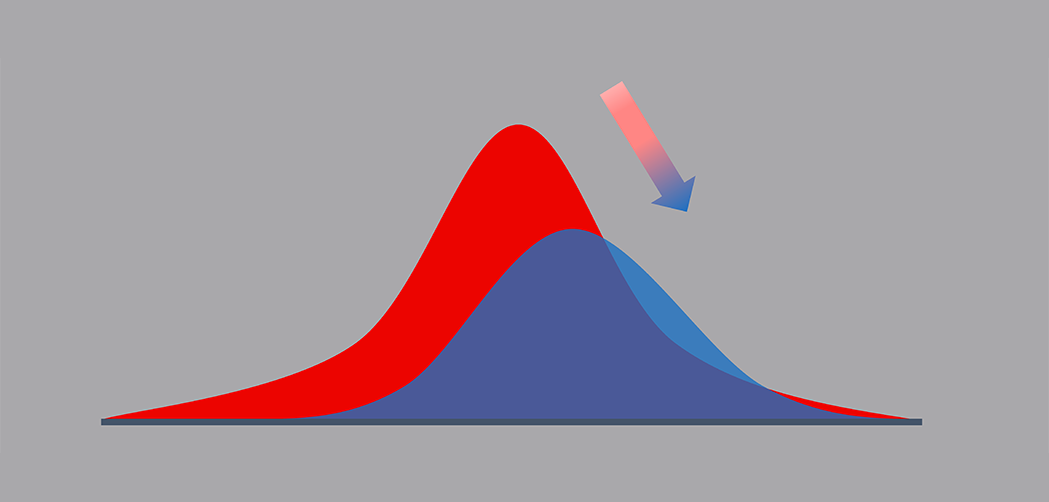
Figure: Data Drift
In this blog, we will explore how to assess data drift in your computer vision projects. We will also clarify the distinction between data drift and concept drift, which are two related concepts with varying impacts on model performance.
Table of Contents
- Why is Maintaining Data Drift Important?
- Why Do Machine Learning Models Drift?
- Different Types of Model Drift
- Algorithms for Detecting Data Drift
- Controlling Data Drift
- Implementation of Data Drift in Python
- Conclusion
Why is maintaining data drift important?
As in the above example of a retail store, we saw how the model deteriorated over time, though it was well-trained. Thus it becomes important to understand first what impacts Model Drift can have on our deployed model.
In the below section, we focus on why it is important to maintain Data Drift.
- Performance Evaluation: Analyzing data drift lets you track how well your computer vision models do over time. You may evaluate if the models are still correctly collecting the required patterns and producing predictions by spotting changes in the data distribution.
- Model Robustness: Adapting to data drift enables you to ensure your computer vision models are resilient. You may increase the models' capacity to deal with environmental variables such as changes in lighting, item appearances, or background clutter by keeping them current with the changing data.
- Business Impact: Data drift can greatly impact how businesses perform. Inaccurate forecasts or lost opportunities may result if the model's performance deteriorates due to shifting data patterns. You may lessen the effect on company operations, customer experience, and decision-making processes by regularly monitoring and resolving data drift.
- Regulatory Compliance: Adherence to regulatory requirements is essential in several businesses. Data drift analysis identifies any deviations from the predicted data distribution, ensuring that your computer vision models continue to be in compliance with laws.
Why do Machine Learning Models Drift?
Machine learning models can experience drift due to various factors. One common reason is the training data's obsolescence or lack of representativeness.
For instance, consider a machine learning model trained to classify customer preferences based on historical data. If the preferences of customers evolve over time, the model may struggle to accurately predict current preferences because it was not trained on the latest data.
Additionally, underlying environment or system dynamics changes can contribute to model drift. For example, if a recommendation system is trained on user behavior in a specific context, such as a certain website layout, changes in the layout or user interface can affect the model's performance.
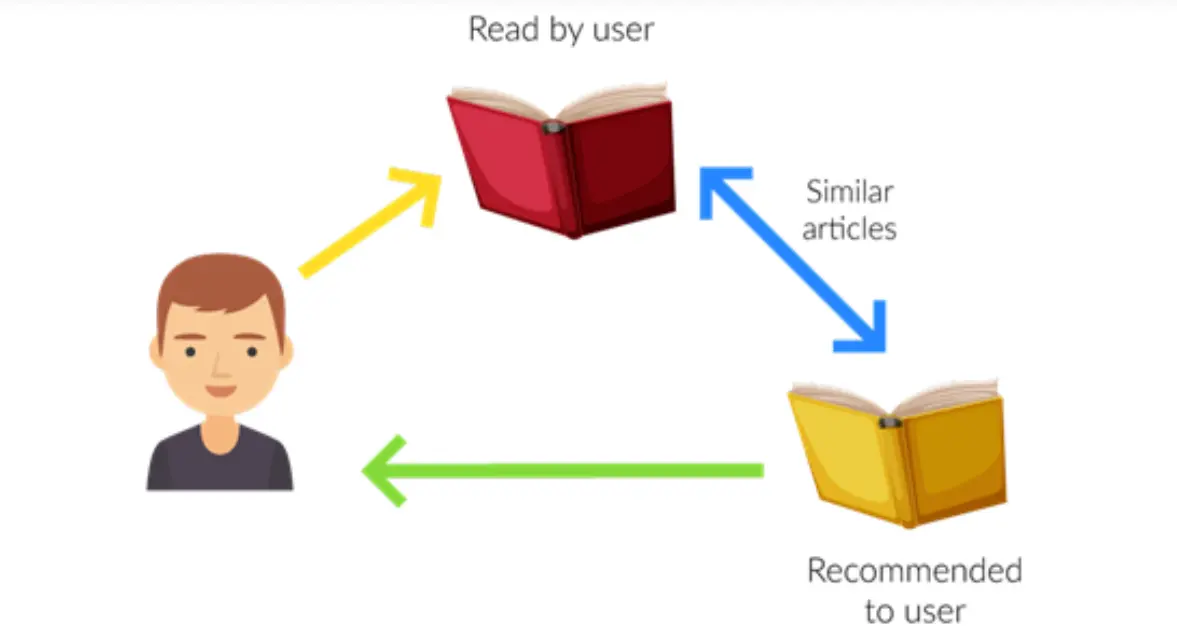
Figure: Recommendation System
Furthermore, biases and inconsistencies in the data can introduce drift. If the training data is biased or contains errors, the model may learn incorrect patterns or make faulty predictions. The model's performance may deviate from its initial accuracy as new data is encountered.
It is important to note that while some machine learning models are more resilient to drift than others, no model is completely immune. Addressing and mitigating drift requires continuous monitoring, updating the training data, and refining the model to ensure its effectiveness in evolving conditions.
Different Types of Model Drift
Two types of Model drift can occur, which include:
- Concept Drift
- Data Drift
In the below section, we explore the above two in detail.
1. Concept Drift
Concept drift is a phenomenon that occurs when the task the model was originally designed for undergoes changes over time.
For instance, consider a machine learning model trained to classify customer sentiment based on social media posts. If users' language or expressions evolve over time, the model may struggle to classify sentiments because the underlying concepts have shifted accurately.
Concept Drift can be further classified into four subcategories as outlined in the research paper "Learning under Concept Drift: A Review" by Jie Lu et al. These subcategories are:
- Sudden Drift: This type of drift involves an abrupt and significant change in the underlying concepts. For example, sudden changes in user behavior or preferences can lead to a sudden drift in the model's performance.
- Gradual Drift: Gradual drift occurs when the underlying concepts change gradually over time. The model's performance slowly deteriorates as it fails to adapt to the evolving patterns.
- Incremental Drift: Incremental drift refers to the situation where new concepts or classes emerge gradually, leading to the model needing to learn and adapt to these new elements.
- Recurring Concepts: In recurring concept drift, the underlying concepts or patterns repeat periodically. The model must identify and adjust to these recurring patterns to maintain its performance.
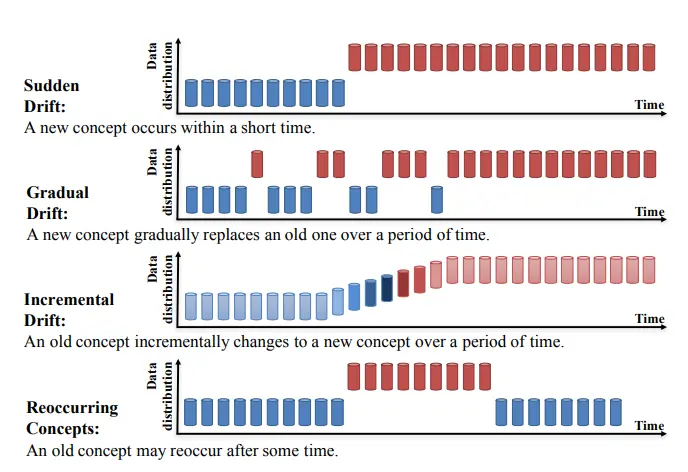
Figure: Types of Concept Drift
2. Data Drift
Data drift, also referred to as covariate shift pertains to changes in input data distribution over time.
For instance, consider a machine learning model trained to determine the probability of a customer purchasing a product based on age and income. If the distribution of customer ages and incomes undergoes significant changes, the model may no longer accurately predict purchase likelihood.
Awareness of both concept and data drift is crucial, and taking proactive measures to prevent or mitigate their impact is essential.
Strategies for addressing drift include continuous monitoring and evaluation of model performance, incorporating new data to update the model, and utilizing machine learning models that exhibit greater resilience to drift.
Algorithms for Detecting Data Drift
From what we studied till now, analyzing and monitoring data drift is very important. For this, different algorithms can be used to monitor data drift.
In the below section, we will study 3 different techniques to monitor data drift, which includes:
- Kolmogorov-Smirnov (K-S) test
- Population Stability Index
- Page-Hinkley method
1. Kolmogorov-Smirnov (K-S) test
The Kolmogorov-Smirnov (K-S) test is a statistical method used to assess whether two datasets originate from the same distribution. It is a nonparametric test that can be employed to evaluate if a sample of data belongs to a particular population or to compare two samples to ascertain their similarity.
In the K-S test, the null hypothesis assumes that the compared distributions are identical. The rejection of this hypothesis indicates the presence of data drift in the model.
The K-S test is valuable for comparing datasets and discerning if they stem from the same underlying distribution. It serves as a reliable tool in detecting and quantifying data drift.
For instance, A data scientist uses the K-S test to compare transaction amounts from a current period to a fraud-free historical period, determining if data drift has occurred and influencing the need for adjustments in a fraud detection system.
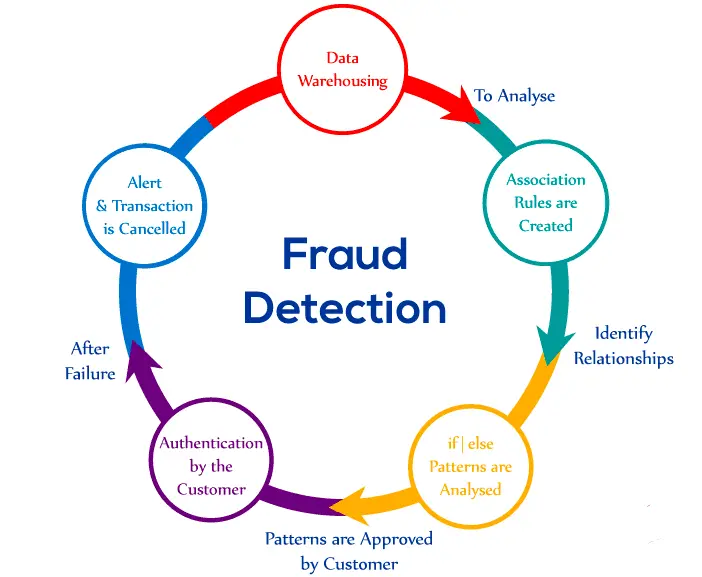
Figure: Fraud Detection
2. Page-Hinkley method
The Page-Hinkley method is a statistical approach utilized to identify variations in the mean of a data series as time progresses. It is commonly employed for monitoring the performance of machine learning models and detecting shifts in data distribution that might indicate model drift.
The initial step involves defining a threshold value and a decision function to implement the Page-Hinkley method.
The threshold value serves as a reference point above which a change in the mean is considered significant, while the decision function evaluates the data and outputs a value of 1 if a change is detected or 0 if no change is detected.
Subsequently, the mean of the data series is computed at each time step, and the decision function is applied to determine if a change has occurred. If the decision function returns a value of 1, it signifies the detection of a change, suggesting that the model may be experiencing drift.
The Page-Hinkley method offers a straightforward and effective means of detecting mean changes in a data series over time. It is particularly valuable for identifying subtle variations that may take time to notice when visually inspecting the data.
However, it is crucial to carefully select the threshold value and decision function to strike a balance between sensitivity in detecting data changes and avoiding false alarms.
For instance, In a computer vision use case, the Page-Hinkley method is applied to monitor the performance of an object detection model over time.
By analyzing the mean confidence scores of detected objects in video frames, the method detects significant drops in detection accuracy, indicating potential model deterioration. This triggers an alert for model retraining or fine-tuning to ensure consistent and reliable object detection performance.
3. Population Stability Index
The Population Stability Index (PSI) is a statistical metric employed to compare the distribution of a categorical variable in two distinct datasets.
The Population Stability Index (PSI) is a tool for quantifying the extent of distributional changes observed in a variable between two samples or over time. Its primary application lies in monitoring population characteristics and detecting potential issues with the performance of a machine-learning model.
Initially developed for tracking shifts in scorecard score distributions, the PSI has expanded its utility to encompass all model-related attributes, both dependent and independent variables.
A high PSI value indicates a substantial disparity between the variable distributions in the two datasets, implying the presence of model drift.
When significant changes occur in the distribution of a variable or when multiple variables exhibit varying degrees of change, it may be necessary to recalibrate or reconstruct the model to enhance its performance.
For instance, in Autonomous Driving, When developing self-driving cars, computer vision models are trained to recognize and classify various objects on the road, such as pedestrians, vehicles, and traffic signs.
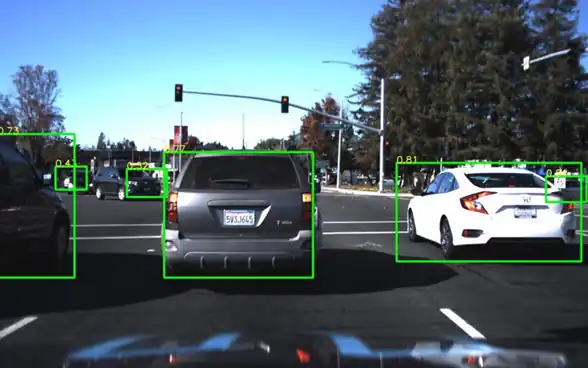
Figure: Object Detection for Autonomous Detection
The PSI can monitor the distributional changes in object categories between training and real-world driving datasets, ensuring the model's performance remains stable.
Controlling Data Drift
Model drift refers to the phenomenon where a machine learning model's performance deteriorates over time due to changes in the underlying data distribution. Correcting model drift involves updating the model to adapt to these changes and maintain accuracy. Here's a detailed approach to addressing model drift:
1. Monitoring
Establish a monitoring system to track the performance of your model regularly. This can involve measuring metrics such as accuracy, precision, recall, or any other relevant evaluation criteria. Set up alerts or thresholds to notify you when the model's performance drops below a certain threshold.
2. Data Analysis
Analyze the data that the model is currently being tested or deployed on. Look for any shifts or changes in the data distribution. This can be done by comparing statistics such as mean, variance, or other relevant features between the training and incoming data.
3. Data Collection
Gather new data that represents the updated or current data distribution. Collecting data that reflects the changes in the real-world scenario is important. This can involve collecting labeled data or using techniques such as active learning to select the most informative samples for updating the model.
For instance, you are working with some object detection task and you observe a model drift. In such a case, the new data available will again go through the pre-processing step before being fed into the model.
In the case of object detection, extracting key-point annotations for new images becomes important. For such a task, you can refer to Labellerr.
Labellerr is a computer vision workflow automation platform with expertise in using LLMs and other foundation models to ease the data preparation process to accelerate AI development.
4. Retraining and Validation
Use the newly collected data to retrain the model. Depending on the scale of the changes, you may need to update the model more frequently or periodically. Retraining can involve strategies such as fine-tuning the existing model, training a new model from scratch, or using transfer learning techniques.
After retraining, evaluate the updated model on a validation set or a holdout dataset to assess its performance. This step helps ensure the model has improved and is still accurate on unseen data.
5. Deployment
Once the updated model has been validated, deploy it into production and replace the previous version. Monitor the model's performance continuously in the production environment to detect any further drift and iterate on the correction process if needed.
Implementation of Data Drift in Python
The following section will employ Evidently, a Python library, to implement drift detection. Evidently is a freely available tool designed specifically for data scientists and engineers engaged in machine learning tasks.
It provides functionalities for testing, evaluating, and monitoring the performance of models throughout the validation and production stages.
1. Prerequisites
For the below tutorial, you should be familiar with the following:
- Python: All the below code will be written using Python.
- Google Colaboratory: Google Colaboratory, also known as Google Colab, is a cloud-based platform that provides free access to Jupyter notebooks and a Python runtime environment.
2. Dataset
In the tutorial below, we used sklearn.datasets.load_digits dataset.
The sklearn.datasets.load_digits function loads the handwritten digits dataset into memory. The dataset consists of 8x8 pixel images of handwritten digits from 0 to 9. Each image is represented as a 64-element array of grayscale pixel values ranging from 0 to 16.
Here are the details regarding the size of the dataset:
- Number of samples: 1,797
- Number of features per sample: 64 (8x8 pixels)
- Number of target classes: 10 (digits from 0 to 9)
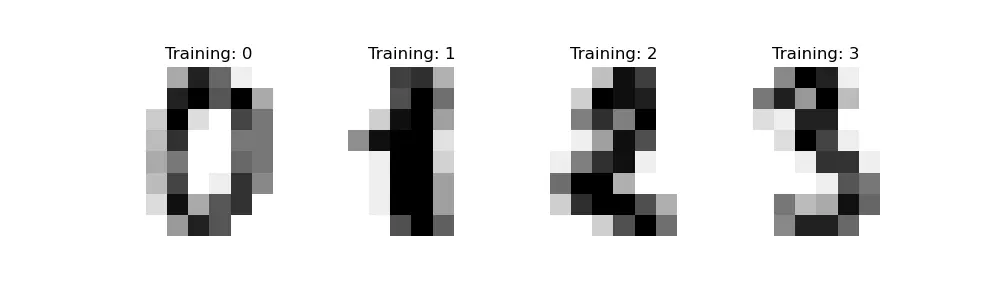
Figure: Sample Images for sklearn.load_digits()
3. Hands-On With Code
We begin by importing the required libraries.
# Import pandas library for data manipulation and analysis
import pandas as pd

# Import numpy library for array operations and mathematical functions
import numpy as np

# Import scikit-learn library
import sklearn

# Import datasets module from scikit-learn for loading datasets
from sklearn import datasets

# Import ColumnMapping class from Evidently library for column mapping
from evidently import ColumnMapping

# Import Report class from Evidently library for generating reports
from evidently.report import Report

# Import DataDriftPreset class from Evidently library for pre-defined data drift metrics
from evidently.metric_preset import DataDriftPreset
Now, we load the dataset.
# Load the "digits" dataset from scikit-learn and store it in the 'data' variable
data = sklearn.datasets.load_digits(as_frame='auto')

# Convert the dataset to a Pandas DataFrame and store it in the 'data_frame' variable
data_frame = data.frame
Next, we create a Report object.
#Create a Report object with DataDriftPreset metric
data_drift_report = Report(metrics=[DataDriftPreset(),])
In order to measure a data drift, we have to have reference data along with current data. So, to do this, we split our data where the first half belongs to training data and the second half we kept as the reference data.
# Run the data drift analysis using the current_data and reference_data
# current_data: The subset of data to analyze for drift (first 60 samples)
# reference_data: The reference subset of data to compare against (remaining samples)
# column_mapping: Mapping between columns in current_data and reference_data
(None in this case)

data_drift_report.run(current_data=data_frame.iloc[:60],
reference_data=data_frame.iloc[60:], column_mapping=None)

# Print the data drift report
data_drift_report
Output
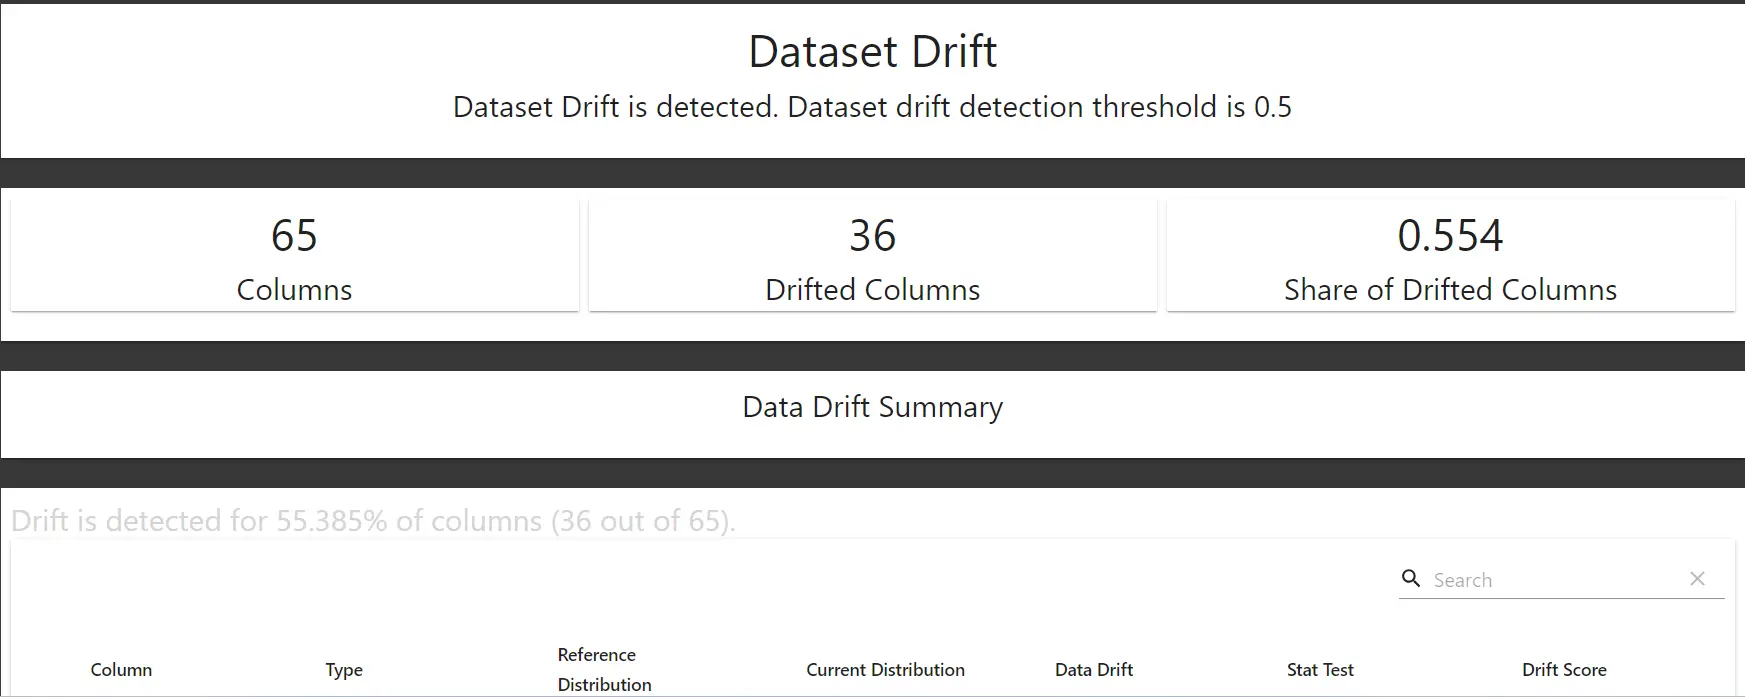
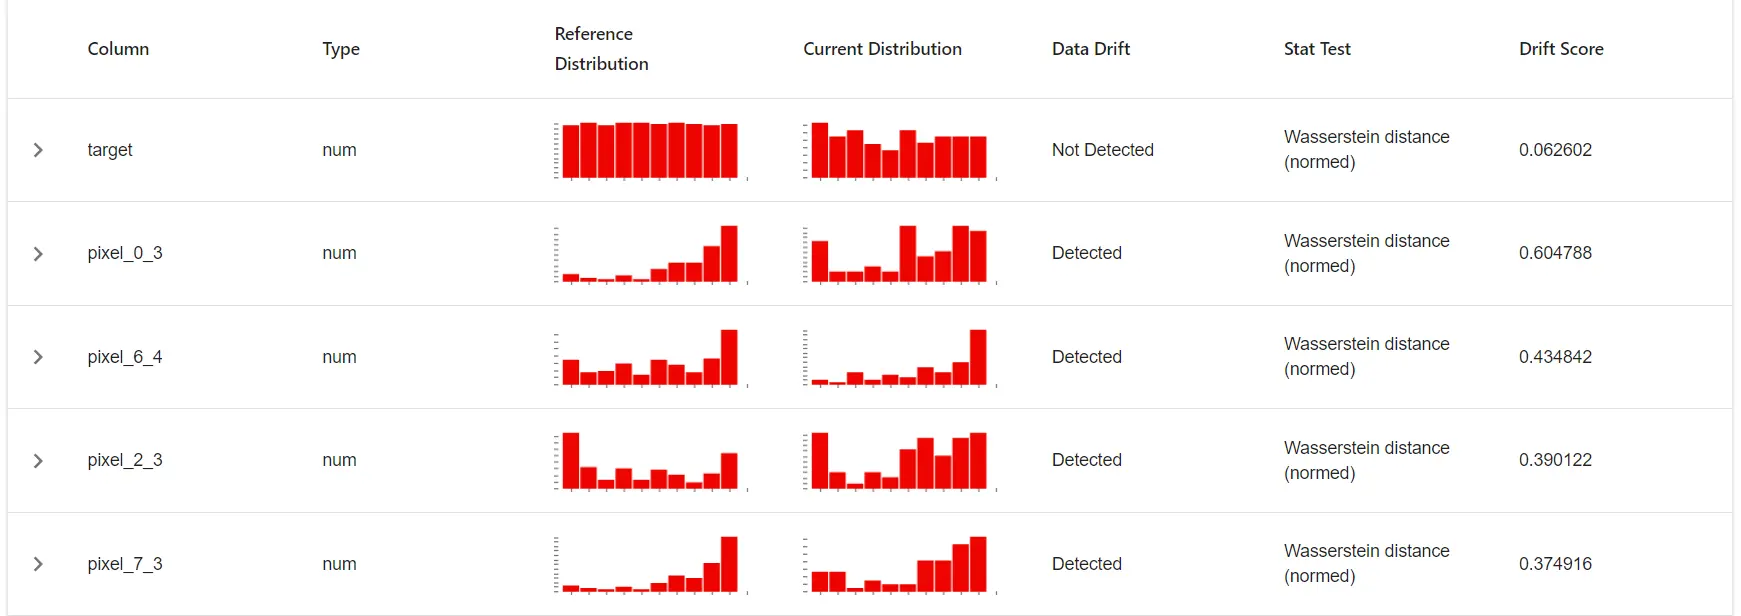
So, as we can see above the report produces 2 different distributions and a drift score. This helps to analyze if there is a drift in the data.
For more detailed information, like printing different metrics and analyze distributions, refer to the below code.
# Create a Report object with specified metrics
report = Report(metrics=[

# Calculate summary statistics for the 'pixel_2_2' column
ColumnSummaryMetric(column_name='pixel_2_2'),

# Calculate the 25th percentile for the 'pixel_2_2' column
ColumnQuantileMetric(column_name='pixel_2_2', quantile=0.25),

# Measure drift in the 'pixel_2_2' column
ColumnDriftMetric(column_name='pixel_2_2')
])

# Run the report by comparing the current data with the reference data
report.run(reference_data=reference_data, current_data=current_data)

# Return the report object
report
Output
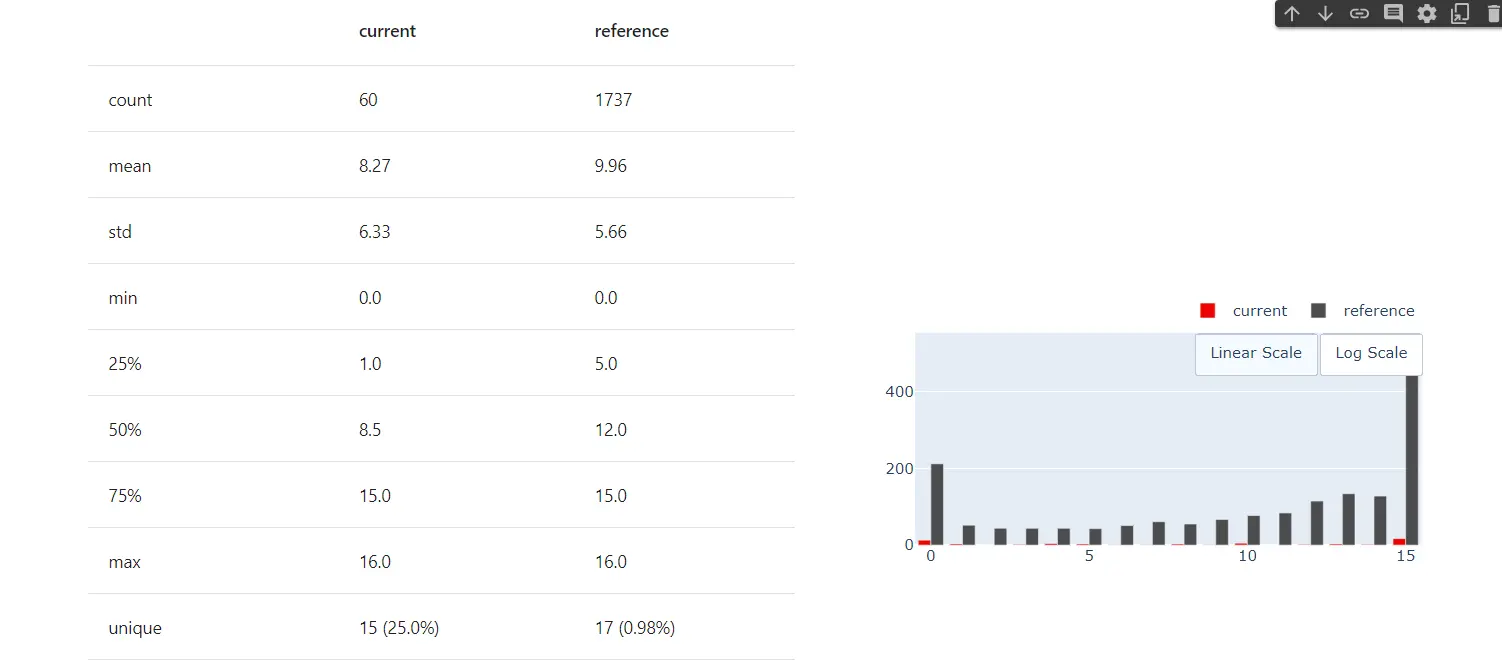
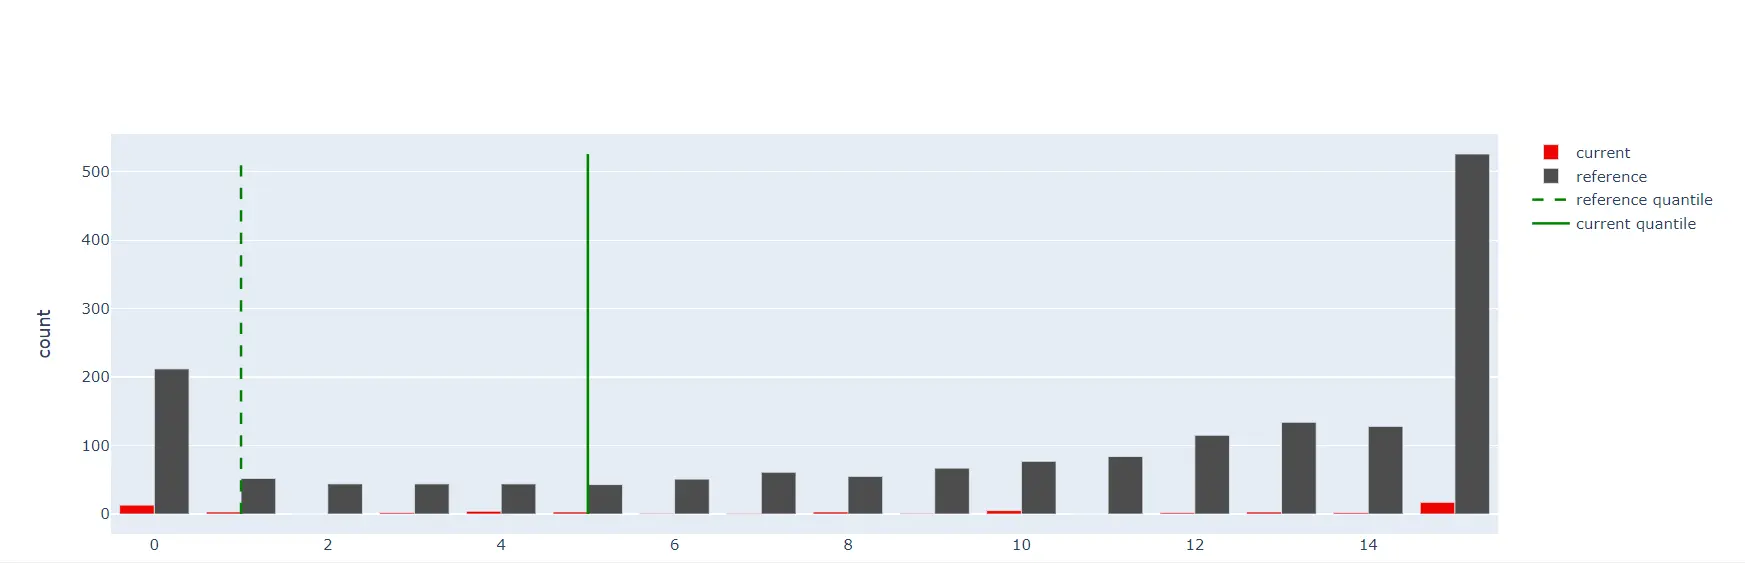
As we can see, evidently allows one to monitor the data. It allows one to see the difference between different parameters for both datasets.
Conclusion
In conclusion, Detecting, monitoring, and correcting computer vision data drift is essential for maintaining the performance and reliability of computer vision models. Data drift refers to the gradual decline in model effectiveness over time as environmental factors and target objects change. Here are the key points to consider:
Further, we saw the Importance of maintaining data drift. Monitoring data drift is crucial for several reasons:
- Performance evaluation: Data drift analysis helps track model performance over time and identify changes in data distribution that may affect predictions.
- Model robustness: Adapting to data drift ensures that computer vision models remain effective in the face of changing environmental variables.
- Business impact: Data drift can significantly impact business operations, customer experience, and decision-making processes, making it important to monitor and address drift to minimize negative effects.
- Regulatory compliance: Data drift analysis helps ensure that computer vision models continue to comply with regulatory requirements.
Machine learning models can experience drift due to various factors, including obsolescence or lack of representativeness in training data, changes in the underlying environment or system dynamics, and biases or inconsistencies in the data.
We also studied Different types of data drift. There are primarily 2 kinds of drift:
- Concept drift: Occurs when the task the model was designed for undergoes changes over time. It can be sudden, gradual, incremental, or recurring, depending on the nature of the changes in the underlying concepts.
- Data drift: Relates to changes in the input data distribution over time. It can impact model performance when the distribution of relevant features changes.
Further, we looked at 3 different algorithms for detecting data drift, which were:
- Kolmogorov-Smirnov (K-S) test: A statistical method used to assess whether two datasets originate from the same distribution. It can help detect and quantify data drift.
- Page-Hinkley method: A statistical approach for identifying variations in the mean of a data series over time. It can be used to detect shifts in data distribution that may indicate model drift.
- Population Stability Index (PSI): A metric for comparing the distribution of a categorical variable in two datasets. It helps quantify the extent of distributional changes observed and identify potential drift.
Lastly, we looked at the Implementation of data drift detection in Python. For this, we used Evidently library provided by Python.

Simplify Your Data Annotation Workflow With Proven Strategies
.png)