
YOLO11 vs SAM3: End-to-End AI-Based Basketball Analytics System
Build an end-to-end AI basketball tracker. We compare YOLO11 vs. SAM3 for speed and precision, implement robust OCR voting logic for jersey recognition, and generate tactical heatmaps to turn raw game footage into pro-level sports analytics.
Modern basketball is a game of numbers. Coaches and analysts obsess over spacing, player movement, and defensive rotations. To get this data, professional teams pay millions for stadium-installed tracking systems.
This leaves a massive gap for amateur leagues, college programs, and individual analysts who lack that budget. They are forced to rely on manual tracking, which is slow, error-prone, and cannot capture the complex dynamics of a fast-paced game.
AI-based computer vision is the solution. It allows us to process standard video footage and extract professional-grade insights without expensive hardware. But which AI architecture is best for the job? This project explores that exact question. We conduct a head-to-head comparison between two powerhouse models: the ultra-fast YOLO11 and the highly precise SAM3 (Segment Anything Model 3).
In this blog, we document the journey of building an end-to-end basketball analytics system. We start by comparing the detection outputs of YOLO11 and SAM3. Then, we optimize the chosen pipeline with Optical Character Recognition (OCR) to identify jersey numbers and generate tactical heatmaps to visualize team strategy.
What Is AI-Based Player Tracking?
Player tracking is the process of logging the x and y coordinates of every person on the court at every moment of the game. In the past, this was done by humans with clipboards. Today, we use computer vision.
The system treats video as a sequence of images. For every frame, the AI must answer two questions: "Where are the players?" and "Who are they?". The first question is solved by object detection or segmentation. The second is solved by tracking algorithms and number recognition.
By automating this, we get objective data. The AI does not get tired in the fourth quarter. It does not have bias. It simply records the physics of the game. This data is the foundation for advanced metrics like player speed, distance traveled, and defensive coverage areas.
The Clash of Architectures: YOLO11 vs. SAM3
The core of this project is a technical showdown. We needed to determine the best approach for tracking fast-moving athletes. We pitted YOLO11, the latest in the famous "You Only Look Once" family, against SAM3, the newest iteration of the Segment Anything Model.
YOLO11 is designed for speed. It is an object detector. It looks at an image and draws a rectangular bounding box around the player. It is incredibly efficient, capable of running in real-time on standard consumer hardware. Its strength is its low latency. It can process frames as fast as the camera captures them.
SAM3, on the other hand, is a segmentation model. It does not just draw a box; it draws a pixel-perfect outline (mask) around the player. It separates the player’s limbs and jersey from the court floor with extreme precision.
We ran both models on the same raw basketball footage. The difference was clear. SAM3 provided superior visual understanding. It could handle complex overlaps where players stood close together. However, YOLO11 was significantly faster. For a system that needs to track ten players, three referees, and a ball simultaneously, the computational weight of SAM3 is a challenge. This comparison helped us design a hybrid approach: leveraging the speed of detection for tracking while using segmentation concepts for precise analysis.
Main Stages of the Analytics Pipeline
Building this system required more than just picking a model. We built a complete pipeline consisting of four main stages:
- Data Preparation and Annotation
- Model Training and Comparison
- OCR Optimization and Identity Tracking
- Tactical Analysis and Heatmap Generation
Each stage was critical. A failure in early detection ruins the final heatmap. We had to ensure every step was robust.
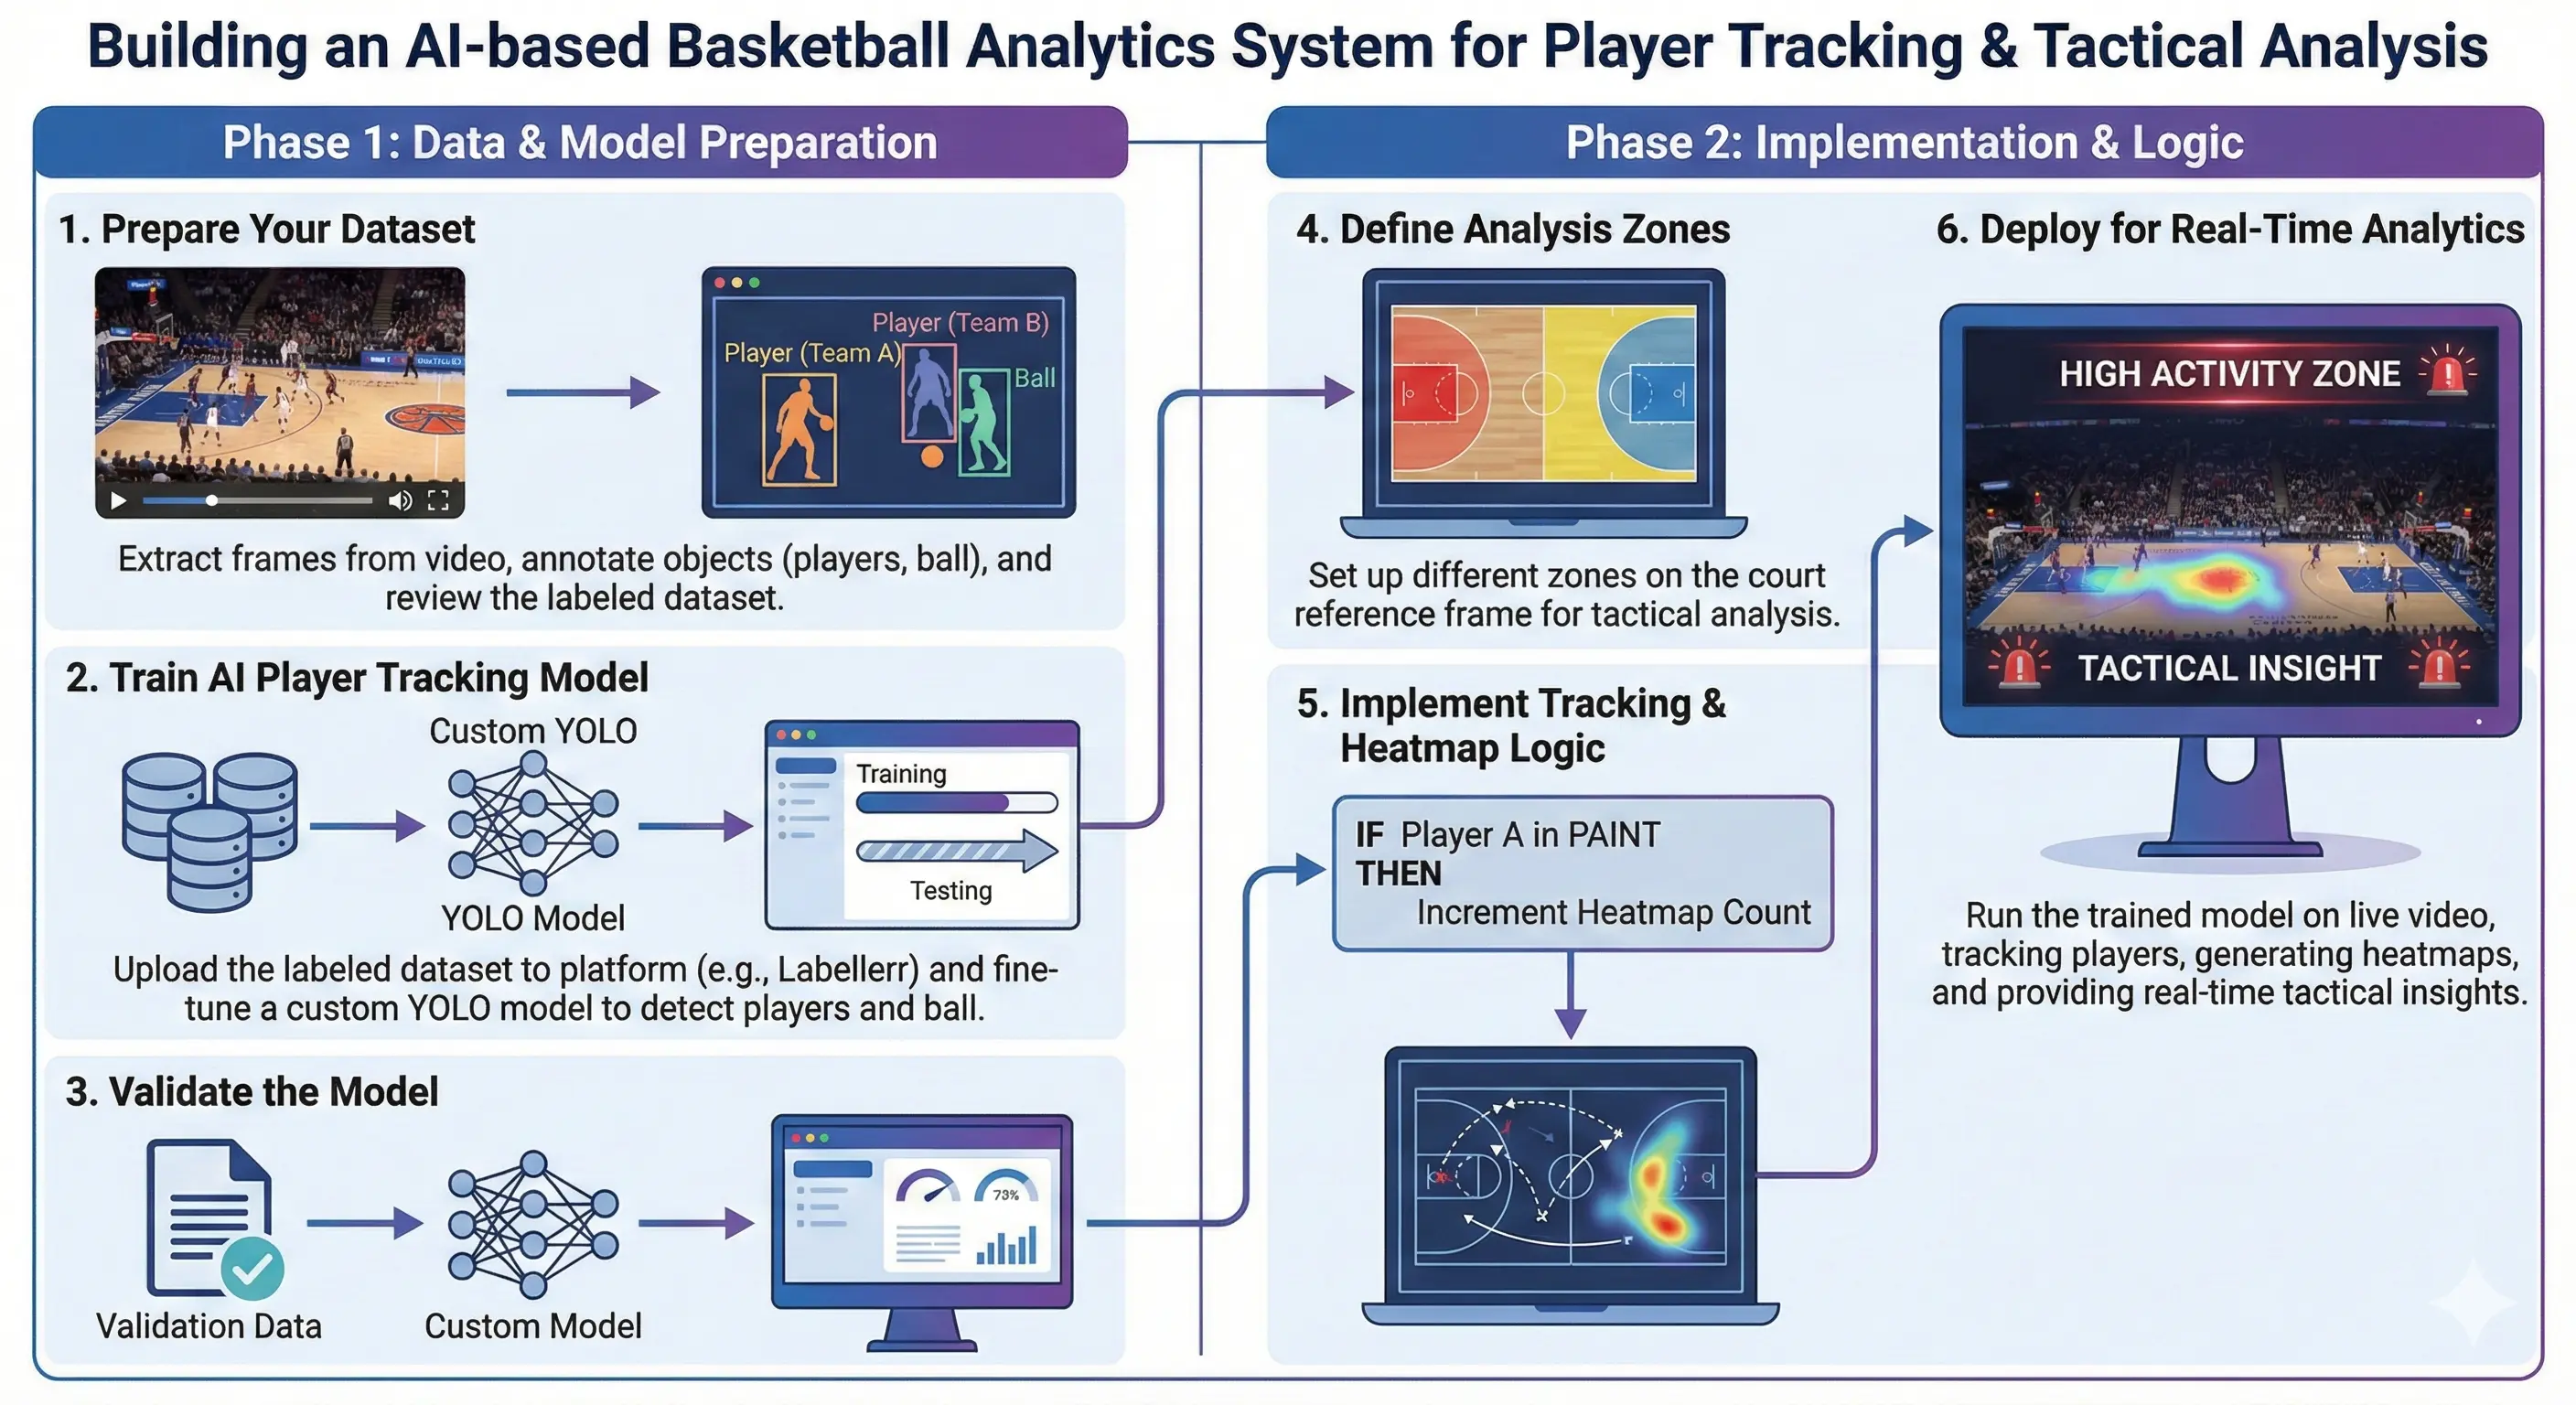
Visualizing the Pipeline
Stage 1: Data Preparation and Annotation
No AI model works without high-quality data. This is especially true in sports, where the background (the court) is complex and players move erratically. We needed a dataset that specifically taught the model to distinguish between "Team White," "Team Blue," "Referee," and "Ball."
We utilized Labellerr for this critical step. The platform allowed us to rapidly annotate our video frames. We drew tight bounding boxes for the YOLO training set and precise polygon masks for the SAM3 comparison.
Label consistency is vital. If a referee is labeled as a player in 10% of the images, the model will fail during the game. We ensured that every label was accurate. We also had to capture players in difficult poses—jumping, diving, and bending over—to ensure the model wouldn't lose track of them during intense plays. Once annotated, the data was exported and prepared for training.
Stage 2: Model Training and Validation
We trained our custom YOLO11 model on the annotated dataset. The goal was to maximize the "Mean Average Precision" (mAP). We monitored the training loss curves closely. If the model overfits, it memorizes the training clips but fails on new games. If it underfits, it misses players entirely.
For SAM3, we utilized the pre-trained weights and fine-tuned it for the basketball context using prompt-based segmentation. We used text prompts like "basketball player" to guide the model.
The validation phase was the proving ground. We tested the models on unseen clips. We looked for "flicker"—cases where the box disappears for a frame and comes back. YOLO11 showed impressive stability. SAM3 showed incredible edge accuracy, perfectly outlining shoes and hands. However, for the primary tracking loop where speed is king, the efficient bounding boxes of YOLO11 proved to be the more practical engine for the pipeline.
Stage 3: OCR Optimization and Identity Tracking
Knowing where a player is is not enough. We need to know who they are. This requires reading the jersey number. This is one of the hardest challenges in computer vision.
Jerseys fold. Players turn sideways. Lighting glares off the fabric. A standard OCR scan of a single frame usually fails. It might read a "23" as a "28" or a "Z". To solve this, we built a custom optimization layer.
We implemented a Voting Mechanism. We do not trust the OCR output from a single frame. Instead, as we track a player across 30, 40, or 50 frames, we collect all the OCR readings. The system stores these values in a buffer. If the system reads "Number 23" forty times and "Number 28" five times, the voting logic confirms the player is #23.
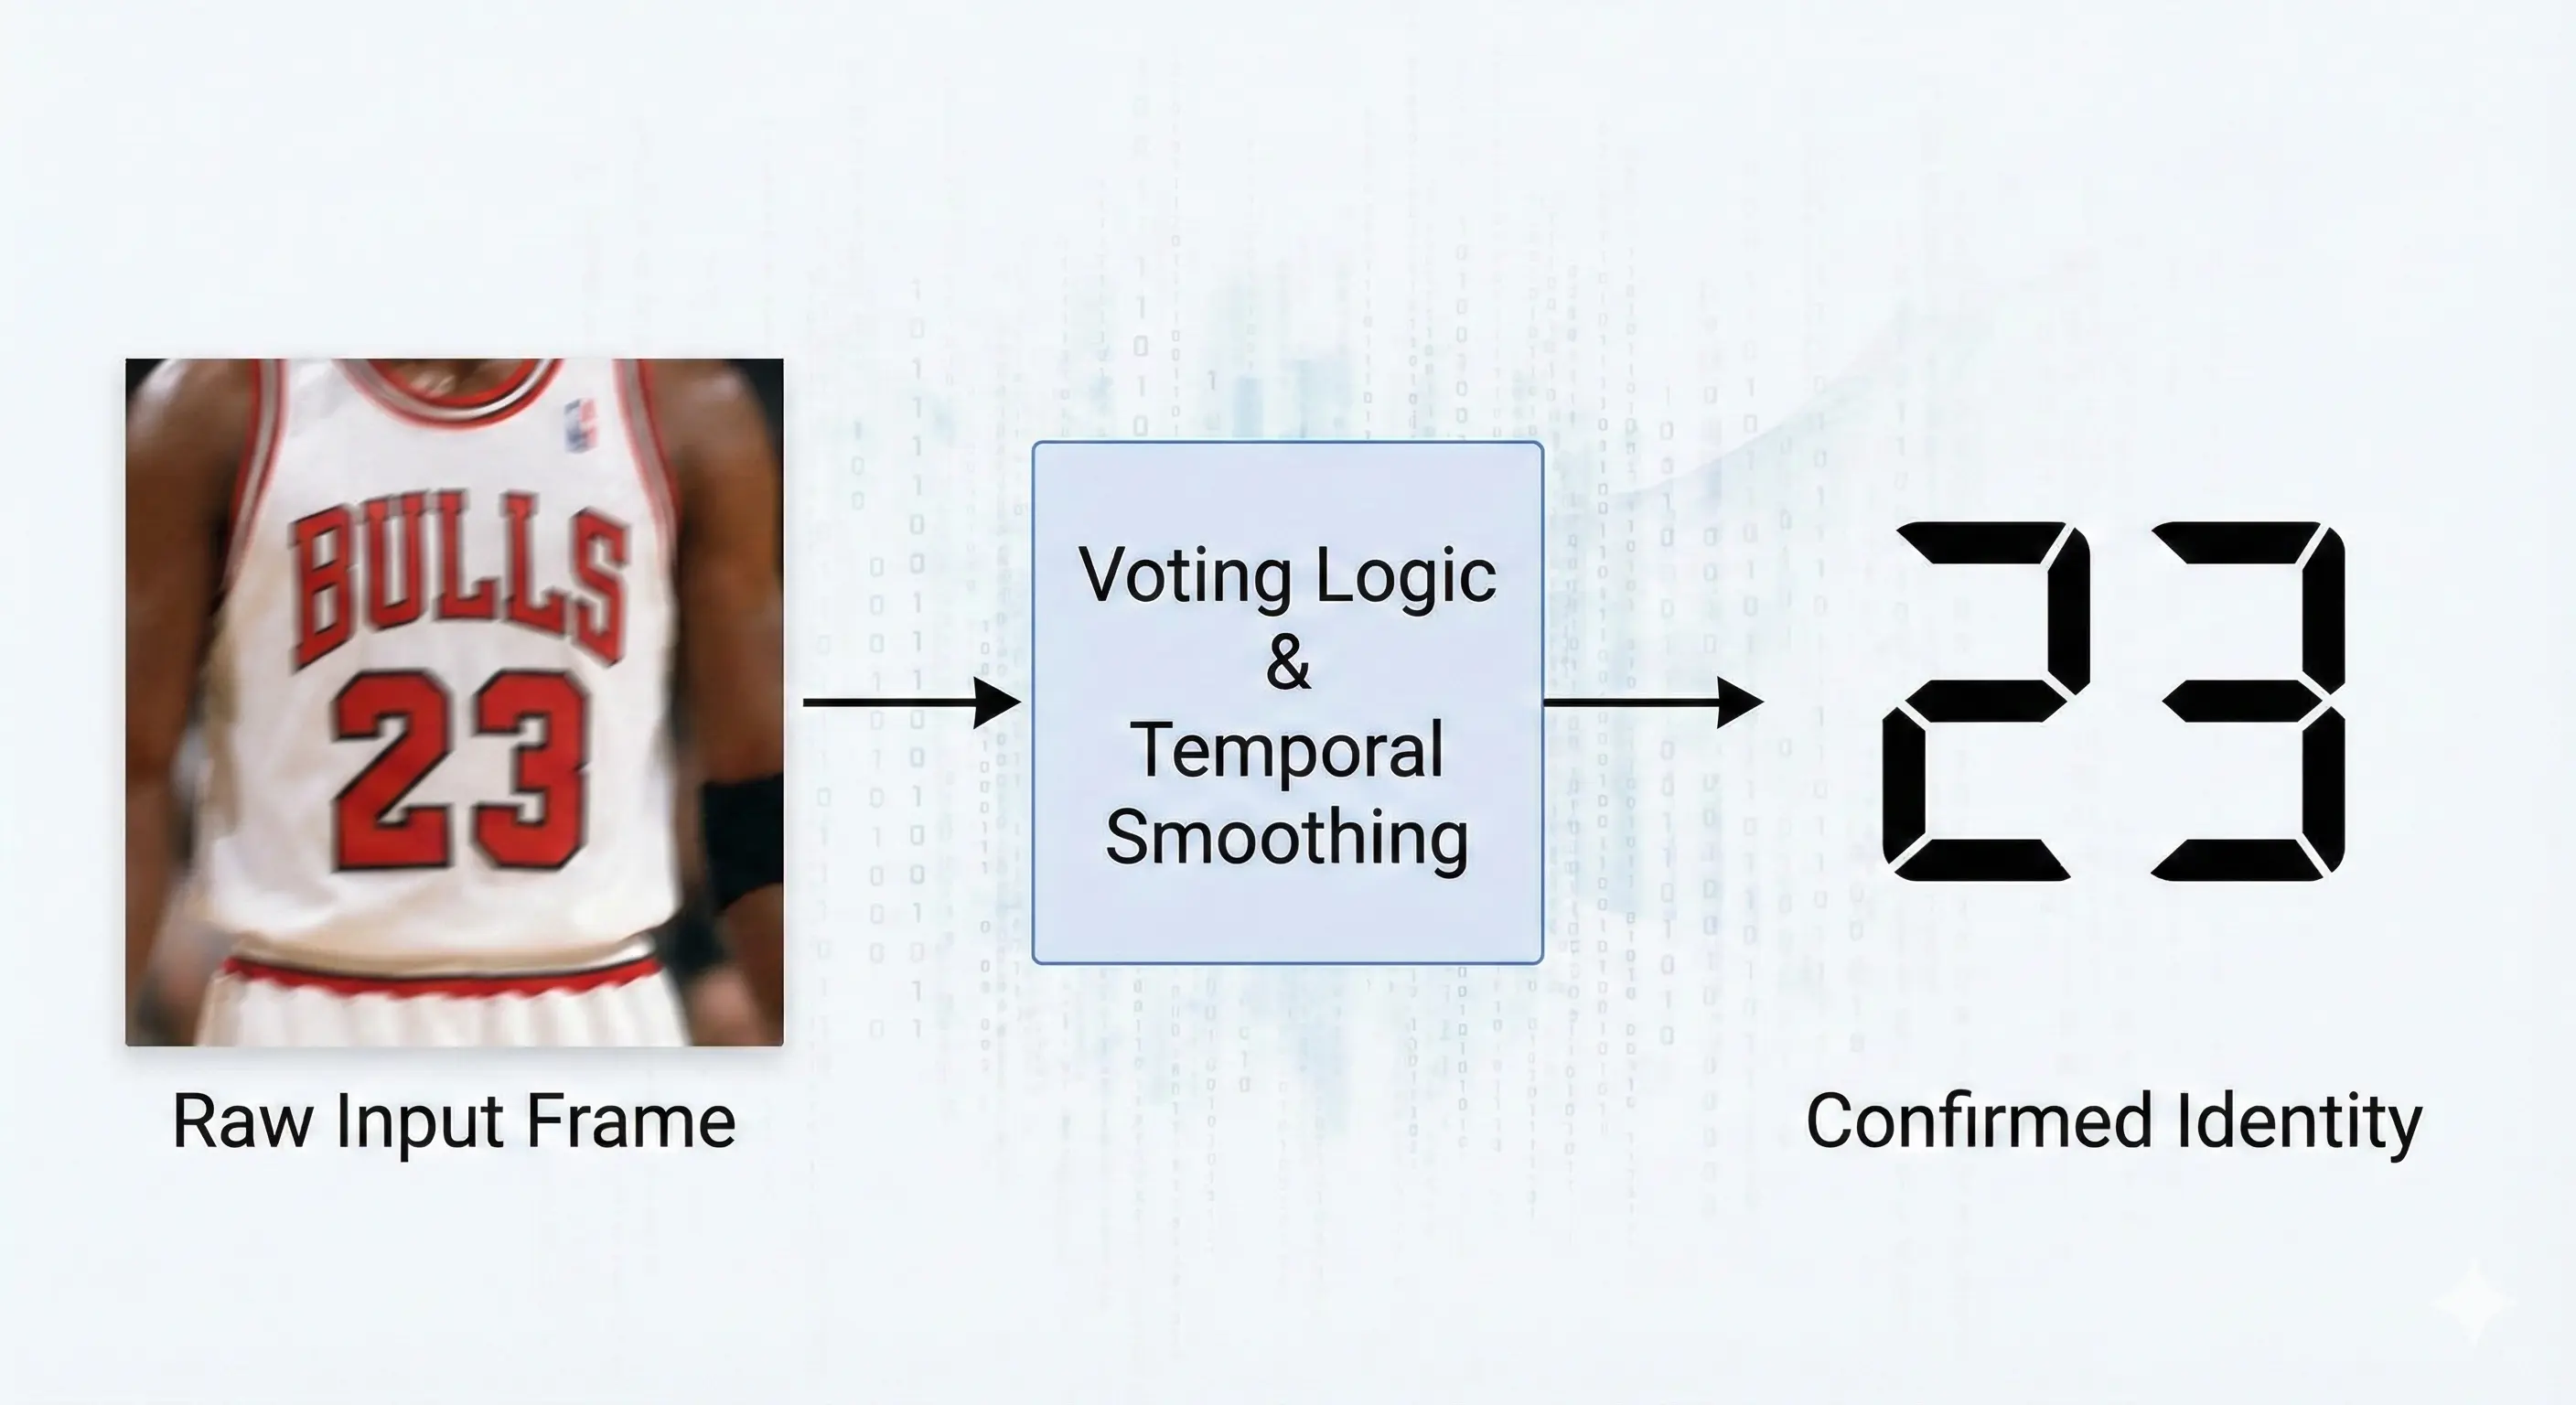
OCR Optimization
This "temporal consistency" filters out the noise. It turns a jittery, unreliable stream of text into a solid, confirmed identity. We combined this with ByteTrack, a tracking algorithm that maintains player IDs even when they cross paths or get momentarily blocked by another player.
Stage 4: Tactical Analysis and Heatmap Generation
The final stage is turning the data into insight. Once we have the stable coordinates of every player, we can generate analytics. We focused on Tactical Heatmaps.
A heatmap visualizes density. It answers the question: "Where does this team live on the court?" We created a 2D matrix representing the basketball floor. For every frame a player stands in a specific spot, we add value to that cell in the matrix.
Over the course of a video, these values accumulate. We apply a color map to this matrix. Low-activity areas remain blue or transparent. High-activity areas turn green, then yellow, and finally red.
This output is incredibly valuable for coaches. A heatmap instantly reveals if a team is spacing the floor well or if they are cluttering the paint. It shows defensive gaps. It turns thousands of rows of coordinate data into a single, easy-to-understand image that tells the story of the game strategy.
Handling Real-World Challenges
A controlled lab test is easy. A real basketball game is hard. We faced several real-world issues that required engineering solutions.
Motion Blur: When a player sprints, they become a blur of pixels. This ruins OCR accuracy. We added an image preprocessing step. Before sending a jersey crop to the OCR engine, we apply sharpening filters and contrast adjustments. This helps the numbers pop out against the jersey fabric.
Occlusion: Basketball is a contact sport. Players constantly screen and block each other. When a player is hidden, the tracker can lose them. We tuned the "persistence" settings of our tracker. This tells the AI to remember a player's last known location for a few seconds. If they re-emerge nearby, the system re-attaches the correct ID instead of treating them as a new person.
lighting Changes: Some arenas are bright; others are dim. By including diverse lighting conditions in our Labellerr annotated training set, we made the model robust. It learned to recognize the shape and movement of a player regardless of the specific lighting hue.
Conclusion
This project demonstrates the immense potential of AI in sports. By moving from a simple YOLO11 vs. SAM3 comparison to a fully optimized pipeline, we built a system that rivals professional tools.
The combination of high-speed detection, smart OCR voting logic, and insightful heatmap visualization provides a complete analytics package. It proves that with the right data and the right architecture, we can democratize sports intelligence.
Whether you are a coach looking for an edge or a developer interested in computer vision, the principles used here robust data annotation, model selection, and temporal post-processing are the keys to building successful AI systems.
Frequently Asked Questions
Why choose YOLO11 over SAM3 for real-time player tracking?
YOLO11 is preferred for real-time tracking because of its superior inference speed. While SAM3 offers precise segmentation masks, it is computationally heavier. YOLO11 provides the necessary low latency to track fast-moving players without dropping frames, making it the practical choice for live sports analytics.
How does the system accurately read jersey numbers despite motion blur?
The system uses a "Voting Logic" mechanism. Instead of relying on a single frame, which might be blurry, the system aggregates OCR readings across 30-50 frames. It confirms a player's identity only when a specific number appears most frequently, filtering out noise and errors.
What role does data annotation play in building this AI model?
High-quality annotation is critical for model performance. Using platforms like Labellerr, we created a custom dataset with tight bounding boxes and precise class labels (e.g., "Team A," "Referee"). This teaches the model to accurately distinguish between different people on the court, which is impossible with generic pre-trained models.

Simplify Your Data Annotation Workflow With Proven Strategies
.png)