
ML Beginner's Guide on Solar Panel Inspection Using Deep Learning

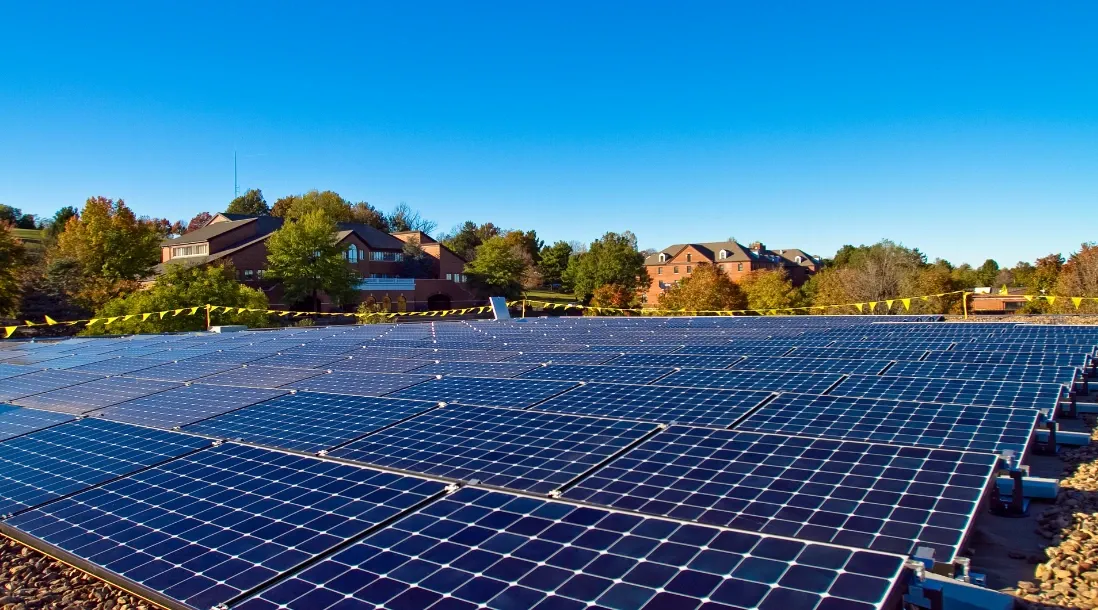
Table of Contents
Objective
The accumulation of dust, snow, bird droppings, and other elements on solar panels diminishes their efficiency which leads to a decrease in energy output.
Monitoring and cleaning these panels are vital tasks.
It underscores the need for an effective procedure to enhance efficiency, cut maintenance costs, and minimize resource usage.
It aims to assess the accuracy of machine-learning classifiers in detecting dust, snow, and bird droppings, as well as physical and electrical issues on solar panels.
The tutorial is useful for ML Beginners, ML Subject Experts, and Product Managers.
Hands-on Tutorial
Outline
1. Importing Libraries
2. Setting Image Dimensions and Loading Dataset
3. Displaying Sample Images
4. Loading Pre-trained VGG16 Model
5. Building a Custom Model on Top of VGG16
6. Plotting Model Architecture
7. Installing and Using VisualKeras for Model Visualization
8. Model Compilation and Training
9. Fine-tuning the Model
10. Plotting Training History
11. Model Evaluation and Result Visualization
1. Importing Libraries
Import necessary libraries such as Pandas, NumPy, Seaborn, Matplotlib, TensorFlow, and others.
Set up warnings to be ignored.
import pandas as pd
import numpy as np
import seaborn as sns
import matplotlib.pyplot as plt
%matplotlib inline

import tensorflow as tf
import random
from cv2 import resize
from glob import glob

import warnings
warnings.filterwarnings("ignore")
2. Setting Image Dimensions and Loading Dataset
Set image dimensions for the model.
Load training and validation datasets from the specified directory using image_dataset_from_directory.
img_height = 244
img_width = 244
train_ds = tf.keras.utils.image_dataset_from_directory(
  '/kaggle/input/solar-panel-images/Faulty_solar_panel',
  validation_split=0.2,
  subset='training',
  image_size=(img_height, img_width),
  batch_size=32,
  seed=42,
  shuffle=True)

val_ds = tf.keras.utils.image_dataset_from_directory(
  '/kaggle/input/solar-panel-images/Faulty_solar_panel',
  validation_split=0.2,
  subset='validation',
  image_size=(img_height, img_width),
  batch_size=32,
  seed=42,
  shuffle=True)
3. Displaying Sample Images
Visualize the dataset for more understanding using Matplotlib's subplot function.
class_names = train_ds.class_names
print(class_names)
train_ds
plt.figure(figsize=(15, 15))
for images, labels in train_ds.take(1):
for i in range(25):
ax = plt.subplot(5, 5, i + 1)
plt.imshow(images[i].numpy().astype("uint8"))
plt.title(class_names[labels[i]])
plt.axis("off")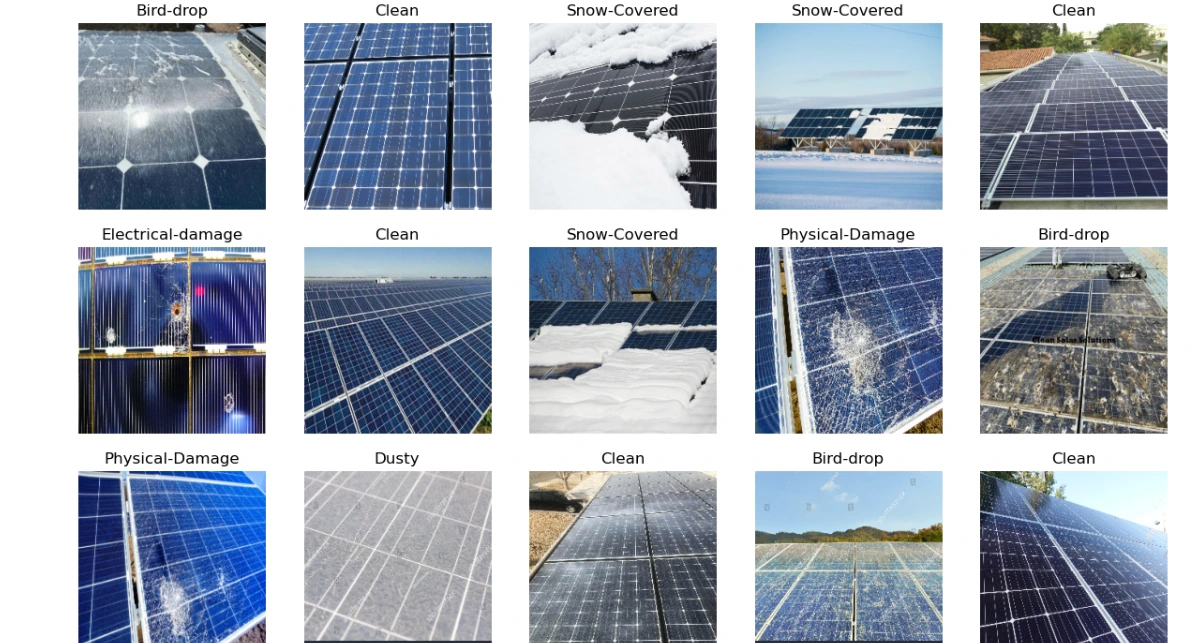
4. Loading Pre-trained VGG16 Model
Load the VGG16 model with pre-trained weights, excluding the top layer.
Set the model to non-trainable.
base_model = tf.keras.applications.VGG16(
    include_top=False,
    weights='imagenet',
    input_shape=(img_height, img_width, 3)
)
base_model.trainable = False
5. Building a Custom Model on Top of VGG16
Create a custom model by adding a global average pooling layer, dropout, and dense layer on top of the VGG16 base model.
Set the model summary.
inputs = tf.keras.Input(shape=(img_height, img_width, 3))
x = tf.keras.applications.vgg16.preprocess_input(inputs)
x = base_model(x, training=False)
x = tf.keras.layers.GlobalAveragePooling2D()(x)
x = tf.keras.layers.Dropout(0.3)(x)
outputs = tf.keras.layers.Dense(90)(x)
model = tf.keras.Model(inputs, outputs)

model.summary()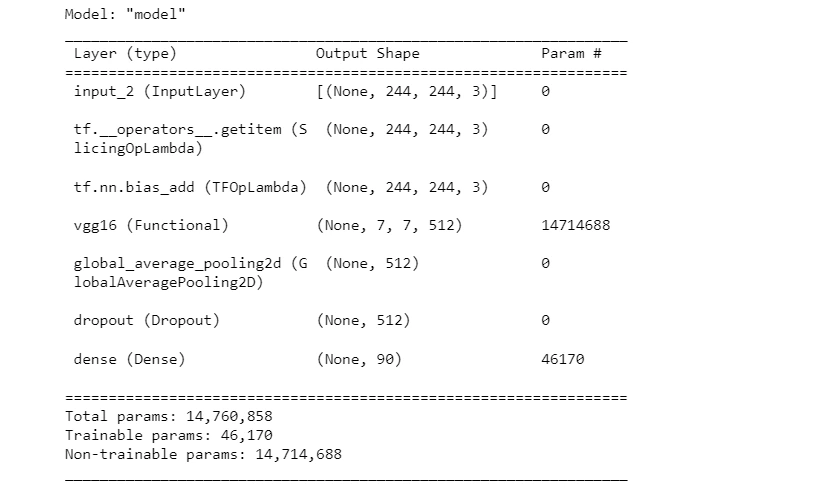
6. Plotting Model Architecture
Plot the model architecture and save it as an image.
from keras.utils.vis_utils import plot_model
plot_model(model, to_file='cnn_plot.png', show_shapes=True, show_layer_names=True)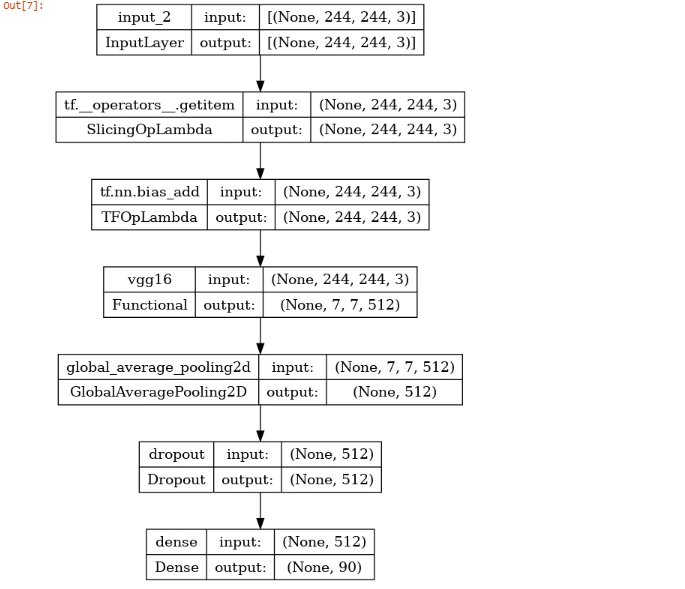
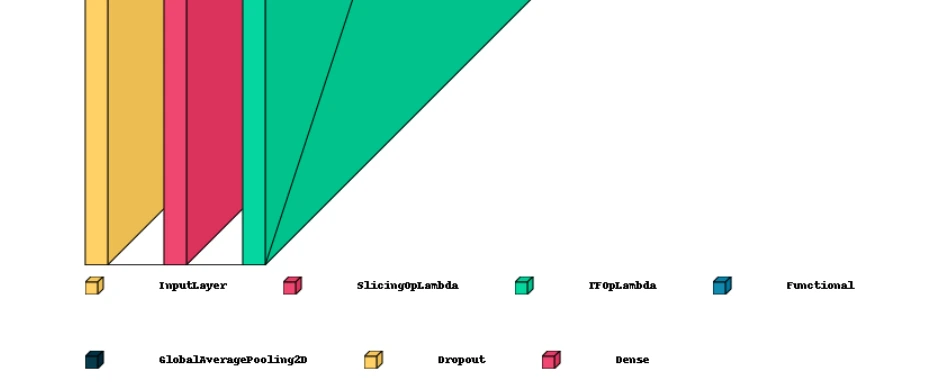
7. Installing and Using VisualKeras for Model Visualization
Install and use VisualKeras to create a layered view of the model.
!pip install visualkeras
import visualkeras
visualkeras.layered_view(model,legend=True,spacing=50,background_fill = 'white')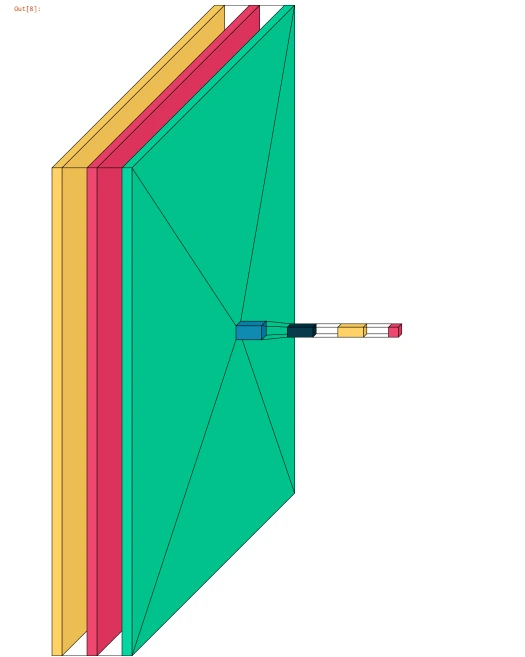
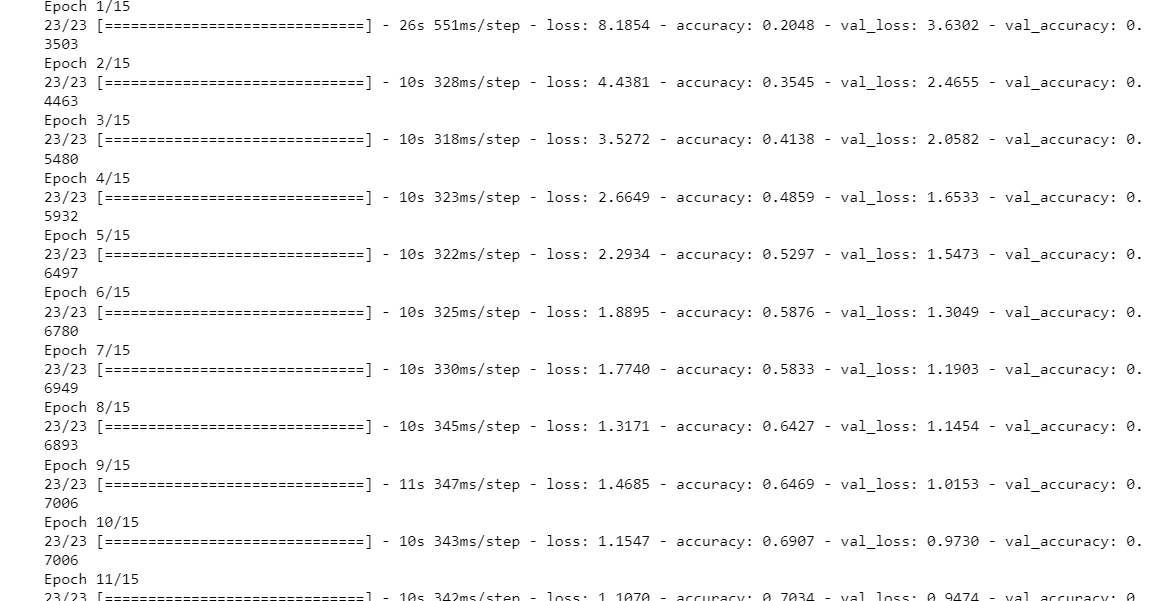
8. Model Compilation and Training
Compile the model with Adam optimizer, sparse categorical cross-entropy loss, and accuracy metric.
Train the model for 15 epochs with early stopping.
model.compile(optimizer=tf.keras.optimizers.Adam(0.001),
              loss=tf.keras.losses.SparseCategoricalCrossentropy(from_logits=True),
              metrics=['accuracy'])
epoch = 15
model.fit(train_ds, validation_data=val_ds, epochs=epoch,
callbacks = [
tf.keras.callbacks.EarlyStopping(
monitor="val_loss",
min_delta=1e-2,
patience=3,
verbose=1,
restore_best_weights=True
)
]
)
9. Fine-tuning the Model
Fine-tune the model by allowing the last 14 layers of the base model to be trainable.
Compile and train the model again.
# fine tuning
base_model.trainable = True
for layer in base_model.layers[:14]:
    layer.trainable = False
model.summary()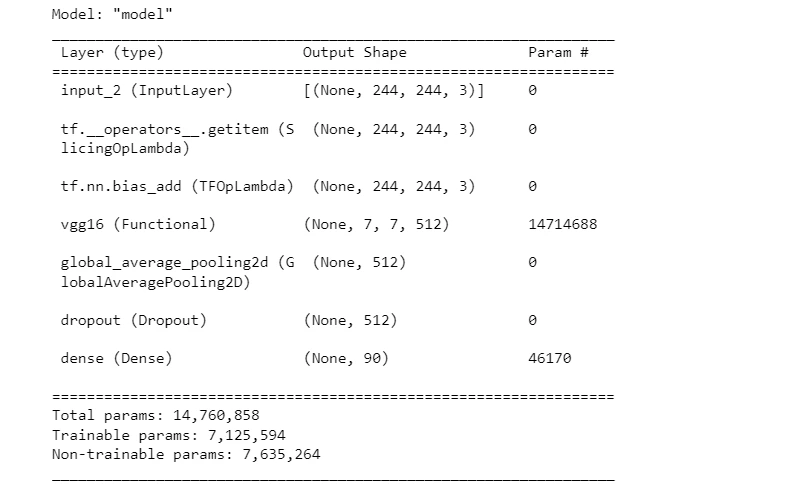
model.compile(optimizer=tf.keras.optimizers.Adam(0.0001),
              loss=tf.keras.losses.SparseCategoricalCrossentropy(from_logits=True),
              metrics=['accuracy'])
epoch = 15
history = model.fit(train_ds, validation_data=val_ds, epochs=epoch,
callbacks = [
tf.keras.callbacks.EarlyStopping(
monitor="val_loss",
min_delta=1e-2,
patience=3,
verbose=1,
)
]
)10. Plotting Training History
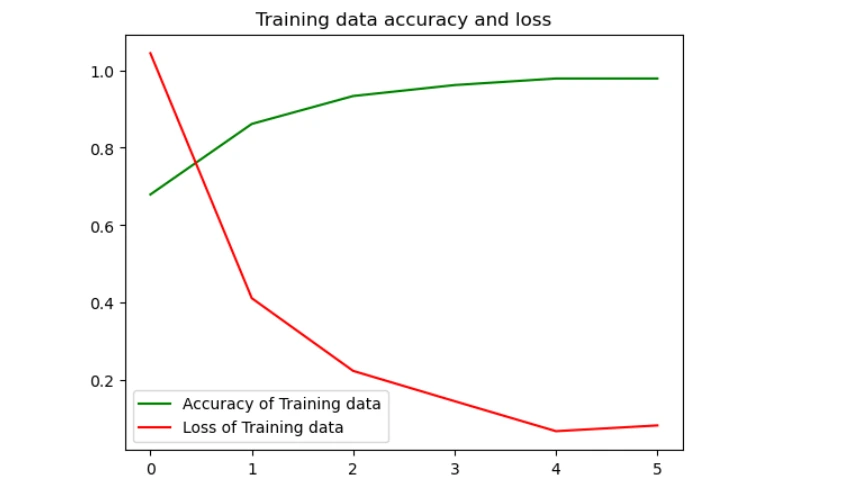
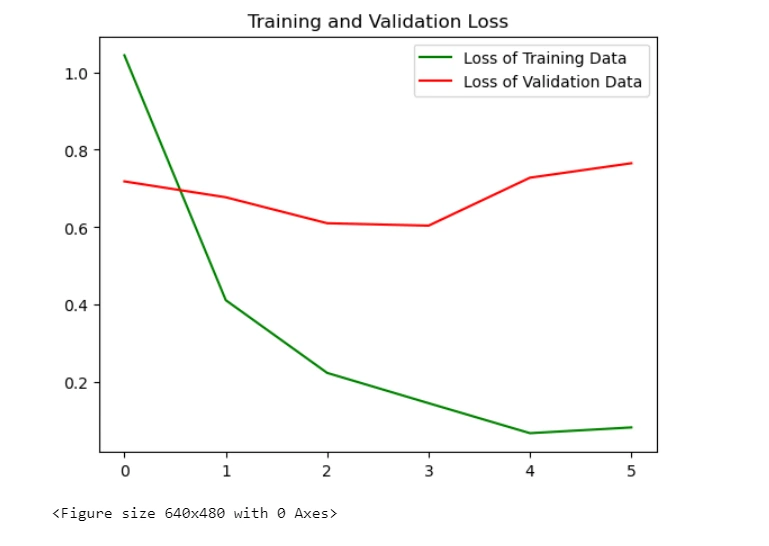
Plot and visualize the training history, including accuracy and loss.
get_ac = history.history['accuracy']
get_los = history.history['loss']
val_acc = history.history['val_accuracy']
val_loss = history.history['val_loss']

epochs = range(len(get_ac))
plt.plot(epochs, get_ac, 'g', label='Accuracy of Training data')
plt.plot(epochs, get_los, 'r', label='Loss of Training data')
plt.title('Training data accuracy and loss')
plt.legend(loc=0)
plt.figure()

plt.plot(epochs, get_ac, 'g', label='Accuracy of Training Data')
plt.plot(epochs, val_acc, 'r', label='Accuracy of Validation Data')
plt.title('Training and Validation Accuracy')
plt.legend(loc=0)
plt.figure()

plt.plot(epochs, get_los, 'g', label='Loss of Training Data')
plt.plot(epochs, val_loss, 'r', label='Loss of Validation Data')
plt.title('Training and Validation Loss')
plt.legend(loc=0)
plt.figure()
plt.show()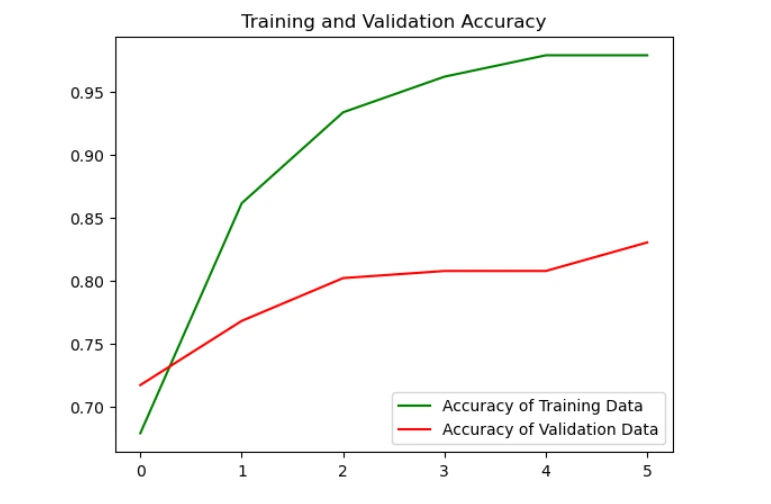
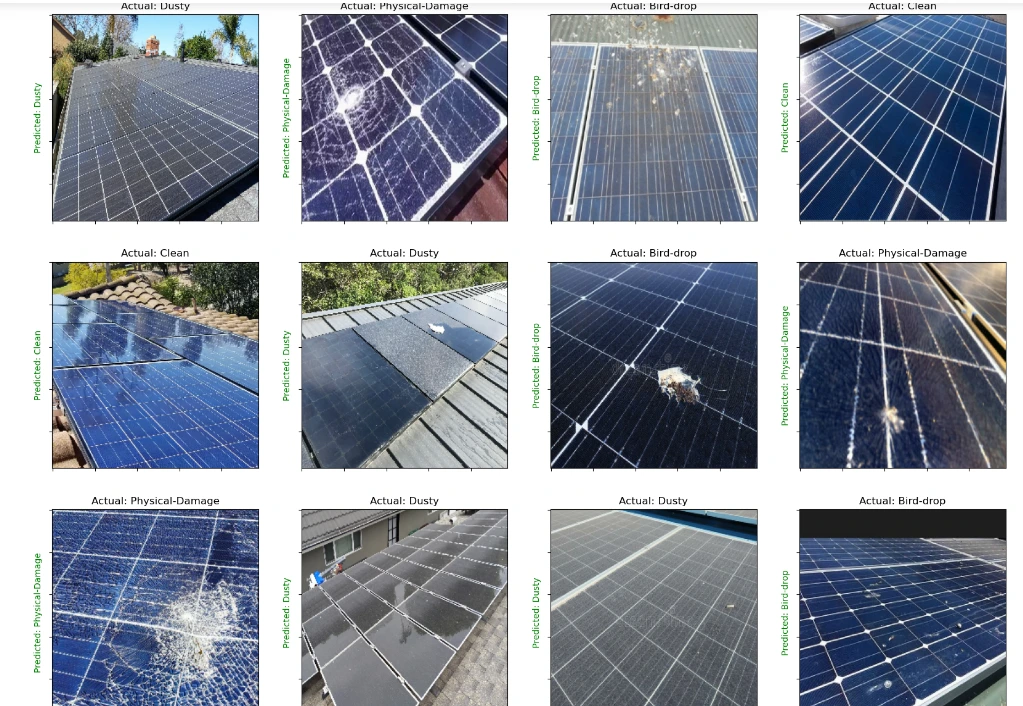
11. Model Evaluation and Result Visualization
Evaluate the model on the validation dataset.
loss, accuracy = model.evaluate(val_ds)

plt.figure(figsize=(20, 20))
for images, labels in val_ds.take(1):
    for i in range(16):
        ax = plt.subplot(4, 4, i + 1)
        plt.imshow(images[i].numpy().astype("uint8"))
        predictions = model.predict(tf.expand_dims(images[i], 0))
        score = tf.nn.softmax(predictions[0])
        if(class_names[labels[i]]==class_names[np.argmax(score)]):
            plt.title("Actual: "+class_names[labels[i]])
            plt.ylabel("Predicted: "+class_names[np.argmax(score)],fontdict={'color':'green'})

        else:
            plt.title("Actual: "+class_names[labels[i]])
            plt.ylabel("Predicted: "+class_names[np.argmax(score)],fontdict={'color':'red'})
        plt.gca().axes.yaxis.set_ticklabels([])
        plt.gca().axes.xaxis.set_ticklabels([])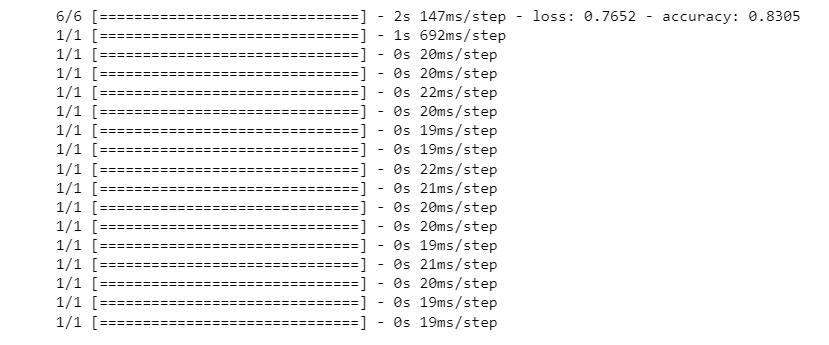
Use Cases of Solar Panel Inspection Model
1. Enhancing Energy Production Efficiency
Detecting and addressing dust, snow, bird droppings, and other contaminants on solar panels helps maintain their optimal efficiency.
Regular monitoring ensures that panels are clean, leading to increased energy production and better overall performance.
2. Reducing Maintenance Costs
By employing machine learning classifiers, the model can identify specific types of contaminants, allowing for targeted and cost-effective cleaning.
Predictive maintenance based on inspection results helps schedule cleaning activities efficiently and reduces unnecessary costs.
3. Minimizing Resource Consumption
Optimized cleaning schedules based on machine learning predictions lead to reduced water and cleaning agent usage.
Smart maintenance strategies contribute to sustainability goals by minimizing the environmental impact of cleaning processes.
4. Improving Long-Term Durability
Continuous monitoring aids in identifying any potential damage or electrical issues on solar panels.
Early detection allows for timely repairs or replacements, contributing to the prolonged lifespan of solar installations.
5. Enhancing Safety Measures
Automated inspection using machine learning reduces the need for manual checks.
It minimizes the exposure of personnel to potential risks associated with climbing and inspecting solar panels.
6. Meeting Regulatory Standards
Regular inspection and adherence to optimal cleaning practices ensure compliance with industry regulations and standards.
Accurate detection of various contaminants helps in meeting cleanliness requirements set by regulatory bodies.
7. Optimizing Energy Output Forecasting
Clean and well-maintained solar panels contribute to more accurate energy output forecasting.
Reliable predictions help in better energy grid management and planning.
It improves overall energy distribution efficiency.
8. Data-Driven Decision-Making
The model's insights provide valuable data for decision-makers to assess the overall health of solar installations.
Informed decisions can be made regarding cleaning schedules, maintenance priorities, and future investments in renewable energy infrastructure.
Conclusion
The hands-on tutorial and use cases highlighted the significance of addressing challenges in solar panel efficiency through machine learning.
The tutorial provides a practical approach to enhance energy production and reduce maintenance costs by developing and fine-tuning a model to detect contaminants and issues on solar panels.
The use cases further emphasize the real-world applications of the model, from optimizing cleaning schedules to meeting regulatory standards and improving long-term durability.
Overall, the integration of artificial intelligence in solar panel inspection offers a promising solution for the energy industry, promoting sustainability, safety, and informed decision-making in the maintenance of solar installations.
Frequently Asked Questions
1. Can a deep learning algorithm detect solar panel defects?
Yes, deep learning algorithms can effectively detect solar panel defects.
By leveraging convolutional neural networks (CNNs) and other deep learning architectures, these algorithms can analyze images of solar panels and identify various defects such as cracks, hotspots, delamination, or other anomalies.
The ability to recognize defects through deep learning contributes to proactive maintenance and improves the overall efficiency and longevity of solar panel installations by allowing for timely repairs or replacements.
2. What algorithms are used in solar panel inspection?
Various algorithms are employed in solar panel inspection, with deep learning algorithms being particularly effective.
Convolutional Neural Networks (CNNs), and VGG 16 are commonly used for image-based inspections. It enables the detection of defects like cracks and anomalies.
Additionally, machine learning algorithms, such as Support Vector Machines (SVM) and Random Forests, can be utilized for classification tasks to identify different types of contaminants like dust, snow, or bird droppings on solar panels.
The combination of these algorithms allows for a comprehensive inspection process, addressing both structural and environmental factors that may impact the efficiency of solar panel systems.
3. How can artificial intelligence improve solar panels inspection?
Artificial intelligence (AI) can significantly enhance solar panel inspection by automating and optimizing the detection of defects and contaminants.
Machine learning algorithms, especially deep learning models like Convolutional Neural Networks (CNNs), enable accurate identification of issues such as cracks, delamination, or hotspots on solar panels through image analysis.
AI also aids in classifying different types of contaminants, like dust, snow, or bird droppings, facilitating targeted and efficient cleaning strategies.
The automation of inspection processes using AI leads to quicker and more precise assessments, reducing maintenance costs, improving energy production efficiency, and extending the lifespan of solar panel installations.
Looking for high quality training data to train your solar panel inspection detection model? Talk to our team to get a tool demo.

Simplify Your Data Annotation Workflow With Proven Strategies
.png)