
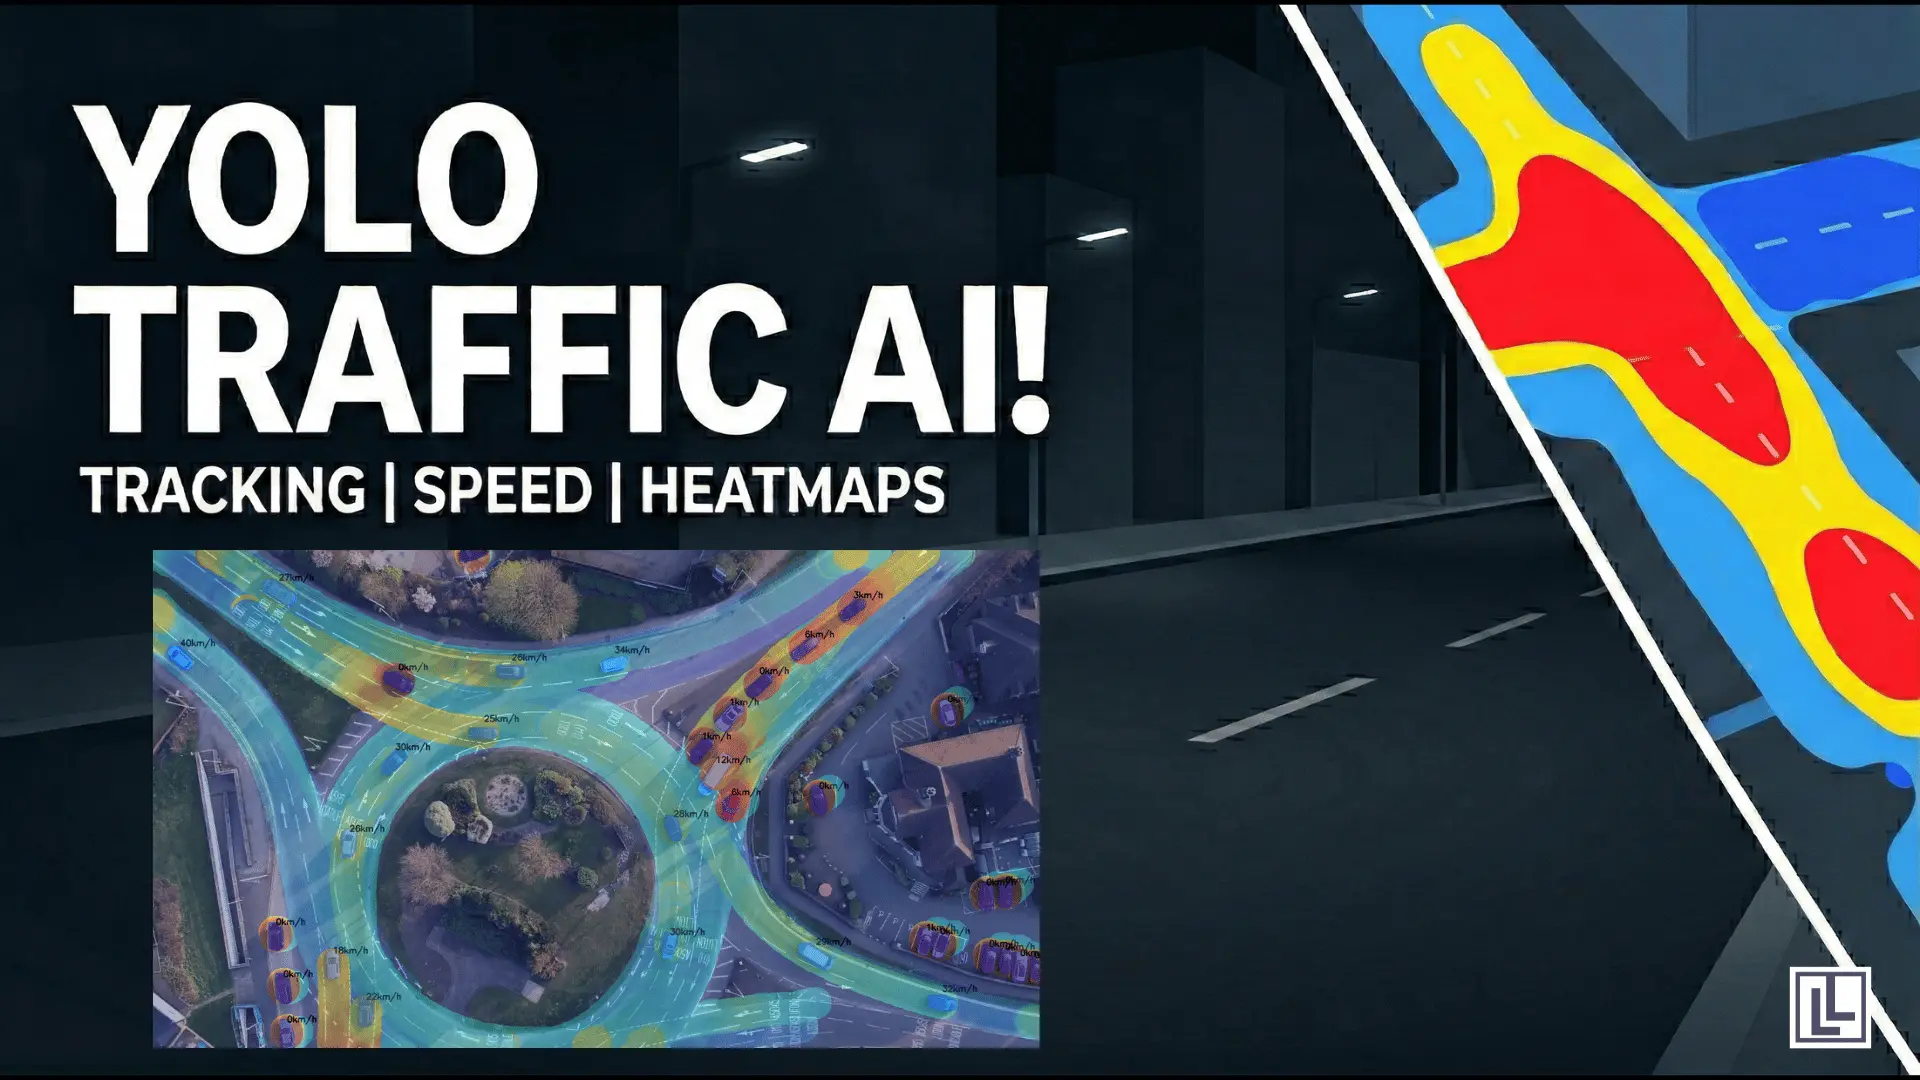
AI Traffic Analysis: Speed Tracking & Heatmaps using YOLO
Discover how to transform standard traffic cameras into intelligent sensors using YOLO AI. This guide explains how to track vehicle speeds in real-time and build dynamic, velocity-weighted heatmaps to identify and solve urban congestion.
Traffic is a problem that affects everyone. Every day, millions of people sit in cars. They wait for lights to change. They crawl through busy streets. This costs us time. It costs us money. It also creates a lot of pollution. Traditional traffic cameras only record video. They do not understand what they see. But today, we can use Artificial Intelligence (AI) to solve this.
By using a tool called YOLO (You Only Look Once), we can turn a simple camera into a smart sensor. This sensor can track every car. It can tell you how fast they are going. It can even show you exactly where traffic jams are starting. In this blog, we will explain how this system works. We will use simple words and clear steps.
What is Intelligent Traffic Analysis?
Intelligent Traffic Analysis is a way to watch roads using computers. In the past, people had to watch videos manually. Now, AI does the hard work. The AI looks at the video. It identifies every car, truck, and bus. Then, it follows them as they move. By measuring this movement, the AI calculates speed. It also creates a Heatmap. This is a map that uses colors to show where traffic is heavy.
The Core Technology: YOLO Segmentation
The first step is for the AI to see the vehicles. We use YOLO Segmentation for this. Most AI systems just draw a box around a car. But segmentation is different. It outlines the exact shape of the car. This is much more accurate. It helps the AI know exactly where the car starts and ends.
When the AI has a perfect outline, it can find the center of the car. We call this the centroid. By tracking this center point, we can be sure our speed calculations are correct. If the box wobbles, the speed might look wrong. But with a precise outline, the movement is smooth.
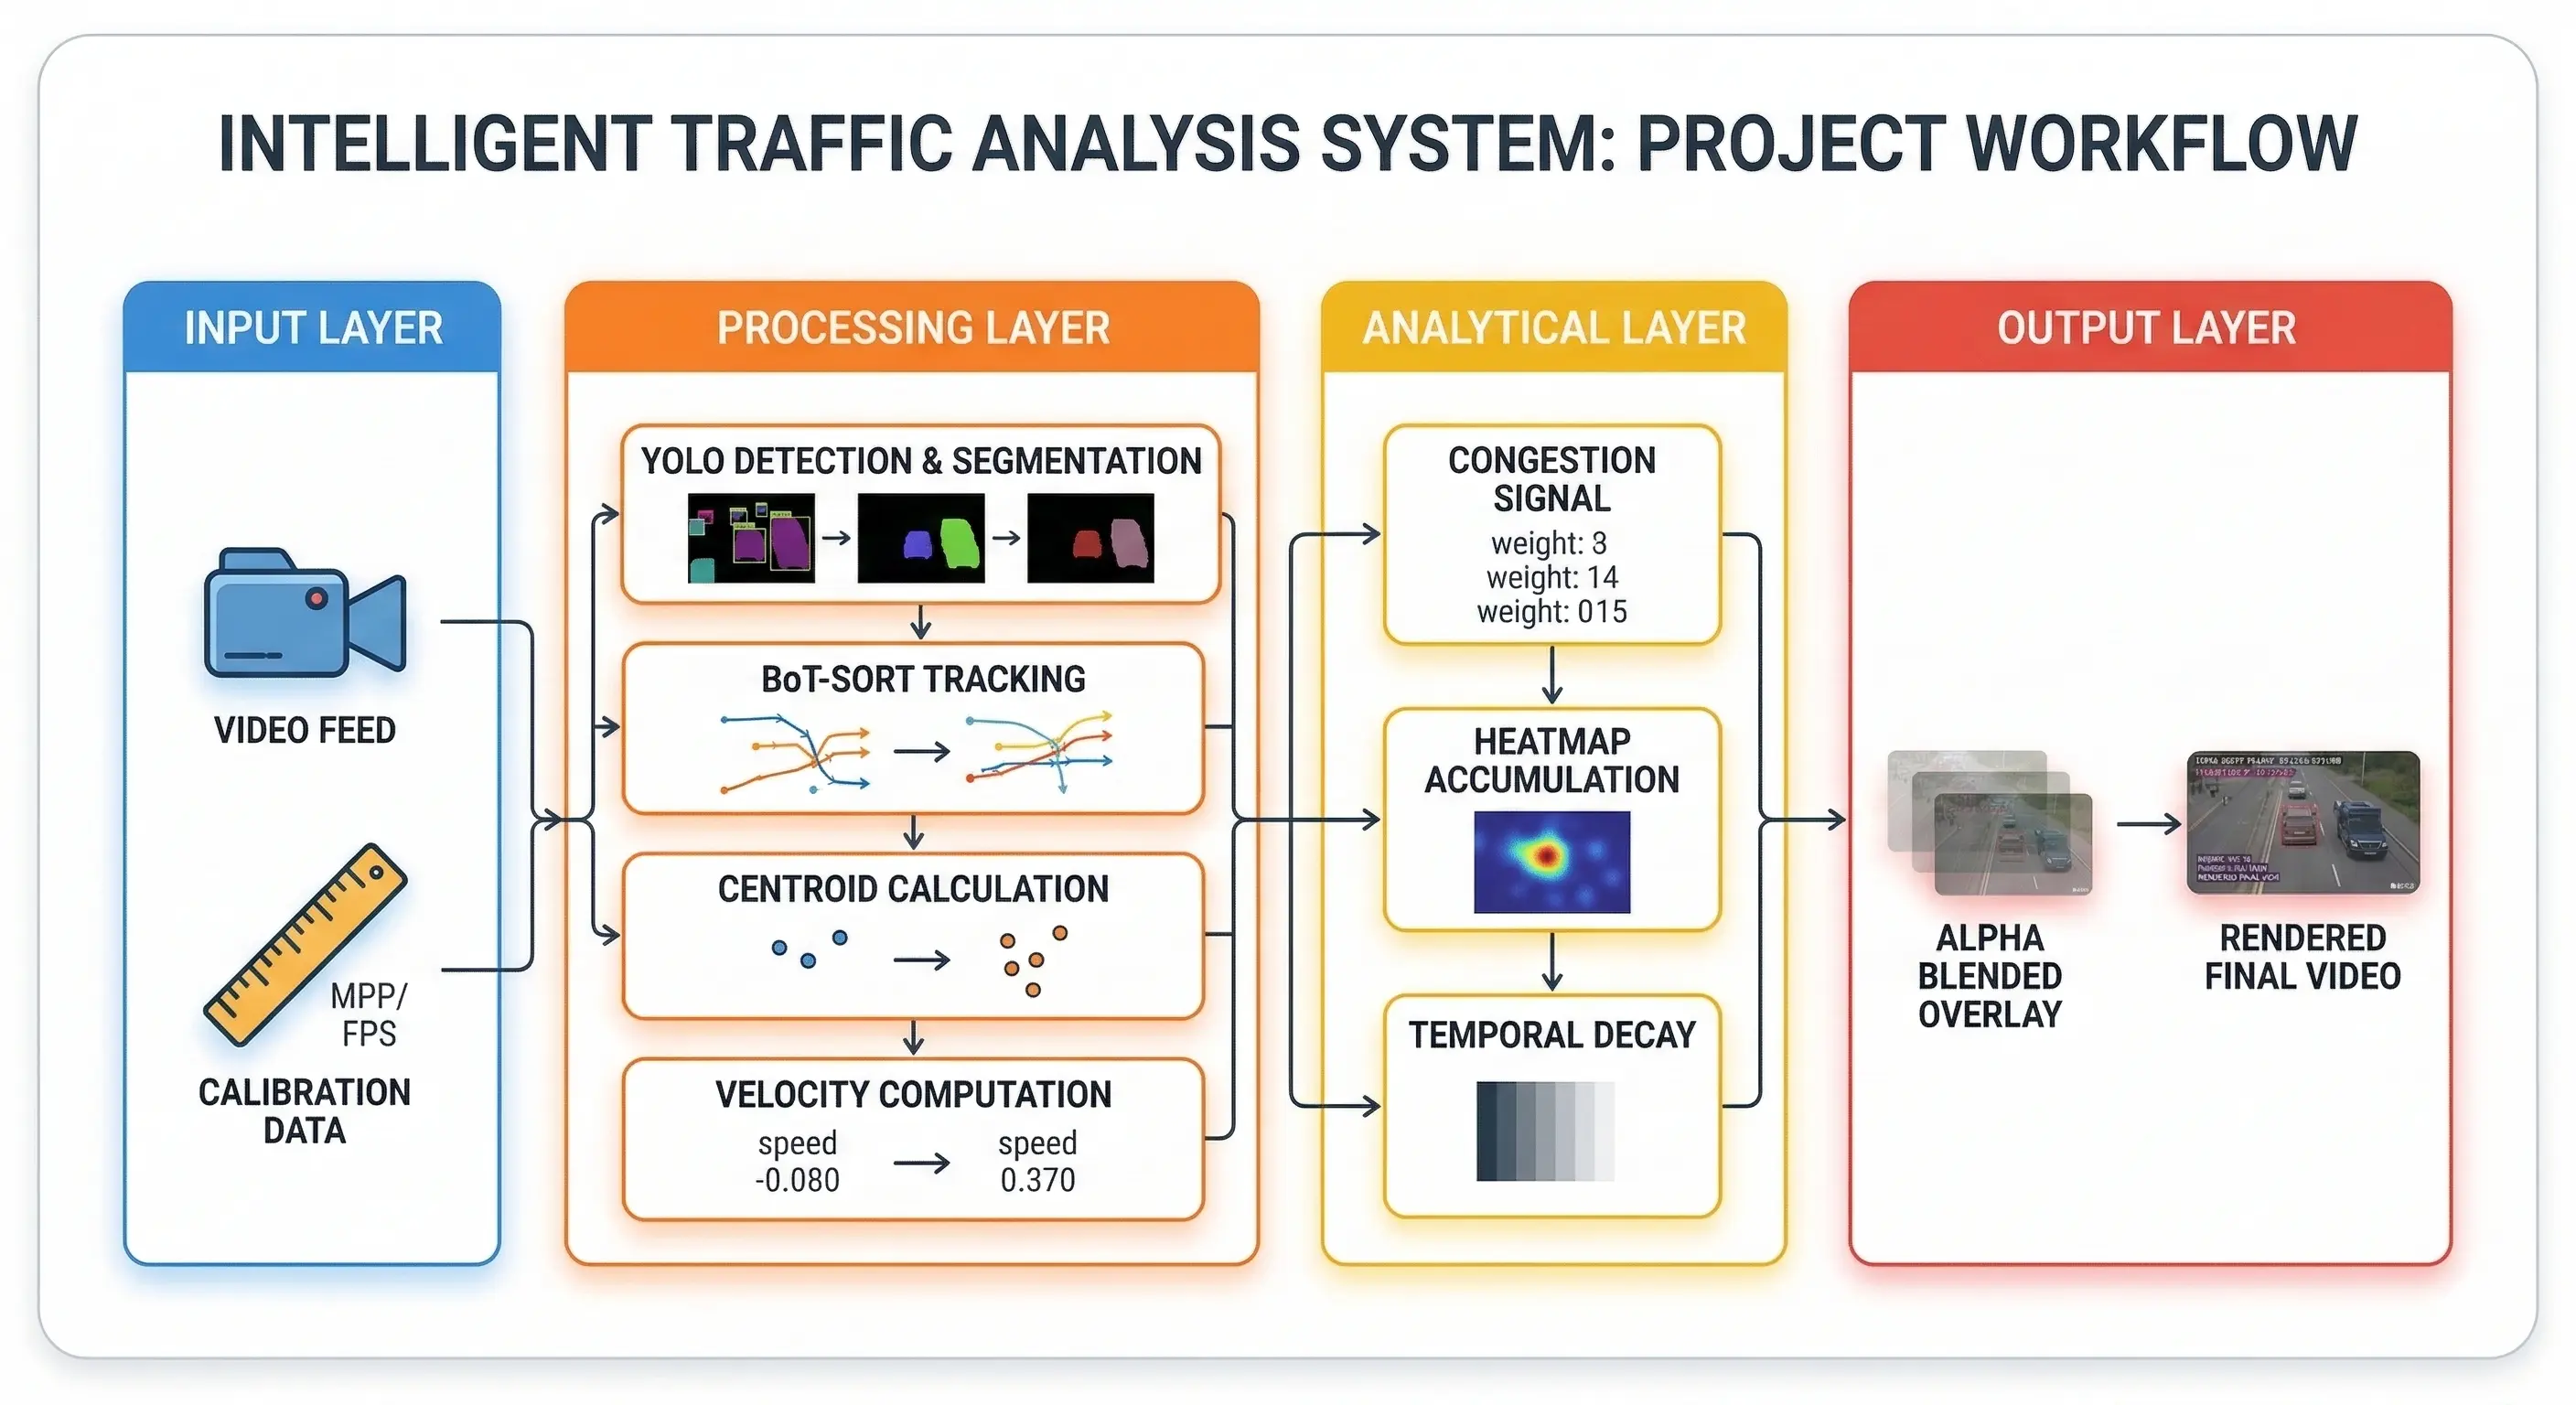
Project Workflow
How the AI "Remembers" Cars
A video is just a long string of pictures. If the AI sees a car in one picture, it must "remember" it in the next one. We use a Tracker for this. The tracker gives every vehicle a unique ID number. For example, "Car #101." This allows the AI to follow the same car across the whole screen.
Without a tracker, the AI would think every new frame has new cars. That would make it impossible to measure speed. By giving each car a name or a number, we can see how far Car #101 moved between two points in time.
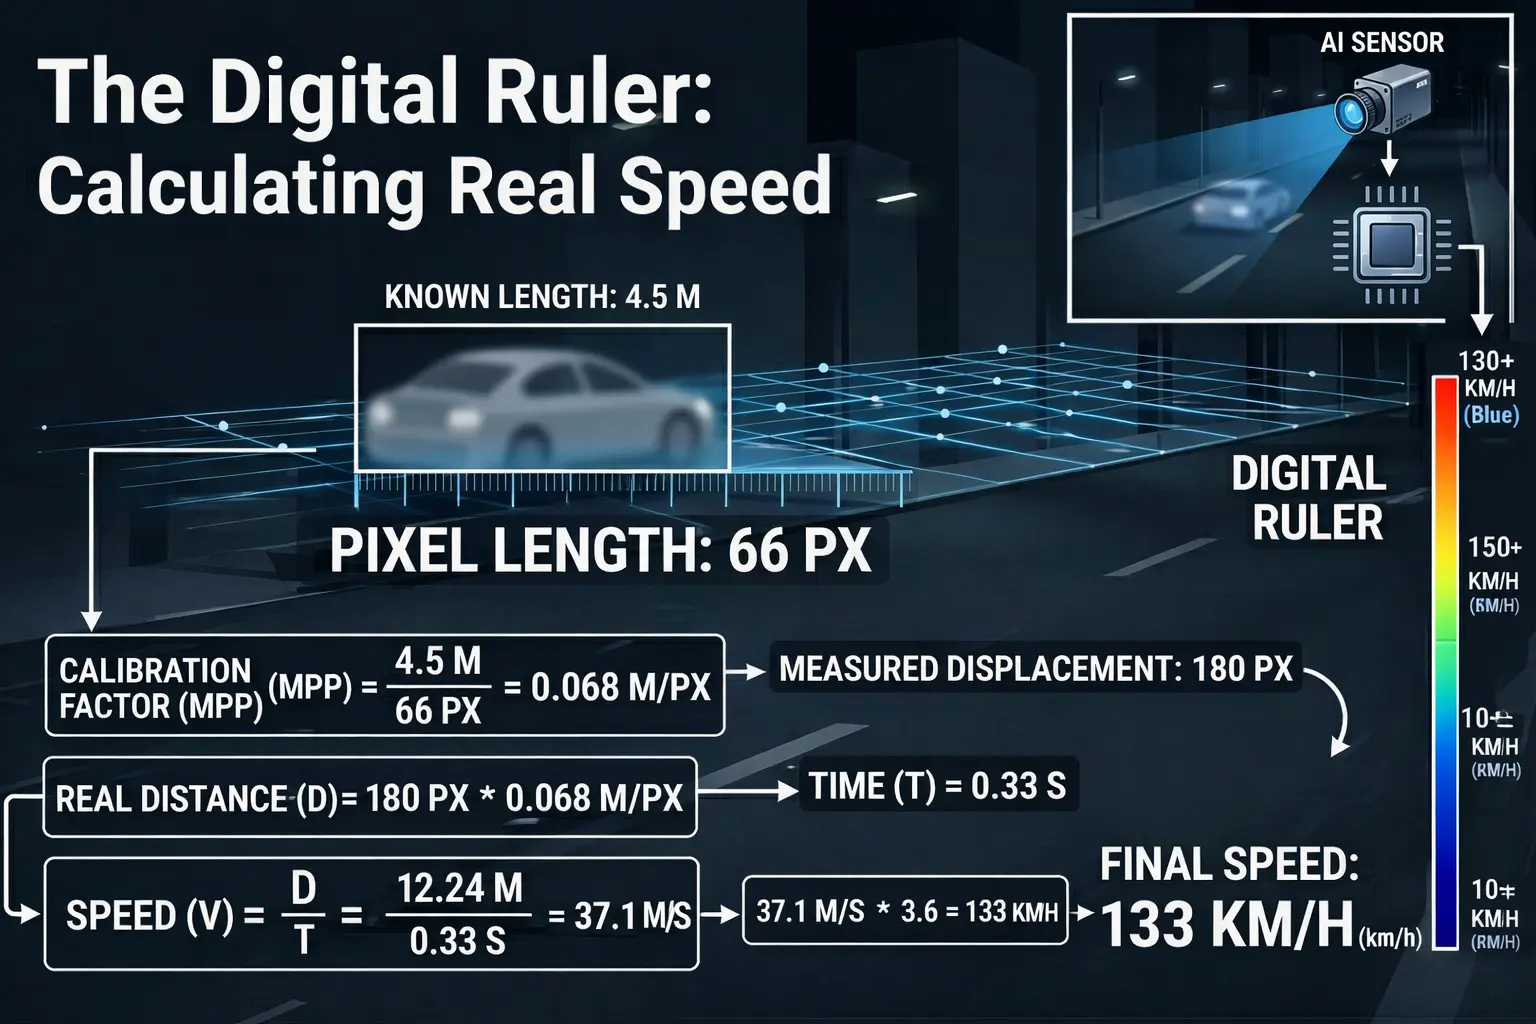
The Digital Ruler: Calculating Real Speed
Computers only see "pixels" on a screen. They do not know what a "meter" is. We use a trick to fix this. It is called Meters Per Pixel (MPP). We know that a standard car is about 4.5 meters long. We measure how many pixels that car takes up in the video. This creates a "digital ruler."
Real Time Speed Calculator
Now, the AI can measure how many meters a car moves every second. For example, if a car moves 100 pixels and each pixel is 5 centimeters, we know the car moved 5 meters. We then convert this to km/h. This makes the data useful for real-world traffic laws.
Understanding the Congestion Heatmap
The most useful part of this project is the Heatmap. This map uses colors to tell a story about the road. It is built using velocity-weighted signals. This means the speed of the car changes the color of the map.

Traffic heatmap
Red Means Slow
When cars stop or move very slowly, they leave a heat signal. The longer they stay in one spot, the redder that spot becomes. This instantly shows where a traffic jam is happening. It helps us see bottlenecks where the road is too narrow for the number of cars.
Blue Means Fast
Fast moving cars do not stay in one spot long enough to leave much heat. These areas stay blue or green. This tells you the lane is clear and traffic is moving well. It shows that the road design is working perfectly in that area.
A Fading Memory
The heatmap has a memory. If a traffic jam clears up, the red color slowly fades away. We use something called temporal decay for this. Every second, the red gets a little bit lighter. If a spot is always jammed, it stays bright red. This helps city planners find the biggest problem spots that never seem to get better.
Why This Matters for Our Cities
This technology isn't just a cool experiment. It has real benefits for everyone. It helps us build Smart Cities.
Faster Trips
If traffic lights "know" there is a jam, they can stay green longer. This clears the road faster. It reduces the time people spend sitting in their cars. This means people get home to their families sooner.
Better Safety
The system can detect when someone is speeding. It can also see if a car has broken down in a dangerous spot. By knowing about these problems instantly, emergency workers can act faster. This saves lives.
Smart Planning
Cities are expensive to build. Before spending millions on a new bridge, planners can look at this data. They can see exactly where the extra lanes are needed. They can also see if a simple change to a traffic light would fix the problem instead.
The Physics of the System
To make the system work, we use basic physics. Speed equals distance divided by time. The AI handles the distance by counting pixels. The time is handled by the video's frame rate. Most videos have 30 or 60 frames per second. By combining these, the AI becomes a very accurate speedometer.
We also use a "sliding window" for speed. This means we look at the last 20 frames to decide the speed. If we only looked at two frames, the speed might jump up and down. By looking at 20 frames, the speed looks smooth and steady. This is called "temporal smoothing."
Making the Heatmap Visual
Once the AI has the speed and the location, it draws on a "blank canvas." This canvas is the same size as the video. Every time a car moves, the AI draws a small circle on the canvas. The color of the circle depends on the car's speed.
Then, we lay this canvas over the original video. We make the canvas a bit see-through. This is called "Alpha Blending." It lets you see the cars and the colorful heatmap at the same time. It makes the data very easy for a human to understand at a glance.
Summary of the Technology
Here is a quick look at the "brain" of our system:
| Part | What it Does |
| YOLO AI | Outlines every vehicle perfectly using segmentation. |
| Tracking | Remembers each car using a unique ID number. |
| Calibration | Uses a digital ruler to turn pixels into meters. |
| Speedometer | Calculates real speed in km/h using physics. |
| Heatmap | Turns traffic jams into bright red signals on the screen. |
| Decay | Makes sure old traffic data slowly fades away over time. |
Challenges We Solved
Building this wasn't always easy. We had to fix several problems. One problem was "perspective." Cars far away look smaller than cars close to the camera. If we didn't fix this, the far-away cars would look like they were moving slowly. We used a "perspective transform" to flatten the road in the AI's mind. This makes the speed accurate no matter where the car is.
Another problem was noise. Sometimes the AI might flicker for a second. By using a "deque" (a type of list), we store the car's history. This helps the AI stay focused even if the video quality is not perfect.
The Future of Traffic
In the future, every street light could have this AI built-in. Cars could talk to the street lights. The lights could tell the cars to slow down because a red zone is appearing ahead. This would prevent accidents before they even happen.
We are moving away from a world where we guess about traffic. We are moving toward a world where we have perfect data. This system is a big step toward that future. It shows that with just a bit of code and a camera, we can make the world a much better place to live.
Conclusion
We taught an AI to understand speed and distance. Now, a basic camera is a powerful tool. We no longer have to guess where the traffic is. We have real data. This system helps keep cities moving. It makes driving safer and faster. Whether you are a city planner or a daily commuter, AI is the key to a better journey.
This project proves that AI is not just for robots or sci-fi movies. It is a tool we can use today to fix real problems in our own neighborhoods. By making our roads "intelligent," we make our lives better.
Frequently Asked Questions (FAQs)
How does the AI calculate the speed of a vehicle just from a video?
The system uses a "digital ruler" concept called Meters Per Pixel (MPP) calibration. By measuring a known physical object in the video (like a standard 4.5-meter car) in pixels, the AI can calculate how many meters a tracked vehicle moves between frames, converting that distance and time into real-world speed (km/h).
What happens to the congestion heatmap when a traffic jam clears up?
The heatmap features a "fading memory" using temporal decay. Every frame, the heat intensity decreases slightly. If a vehicle leaves the area and traffic starts moving fast again, the red bottleneck zones will slowly fade away, ensuring the map only shows active or persistent congestion.
Do I need specialized, expensive radar cameras to run this AI?
No, that is the main advantage of this system! As long as the camera provides a clear, high-definition video feed of the road, the YOLO AI and BoT-SORT tracker can process standard optical video to generate accurate speed and congestion data.

Simplify Your Data Annotation Workflow With Proven Strategies
.png)