
ML Beginner's Guide To Build Crop Yield Prediction Model: Tutorial
Learn to predict crop yield using machine learning! This beginner’s guide covers data preprocessing, visualization, model selection, and evaluation to enhance agricultural decision-making and boost productivity.

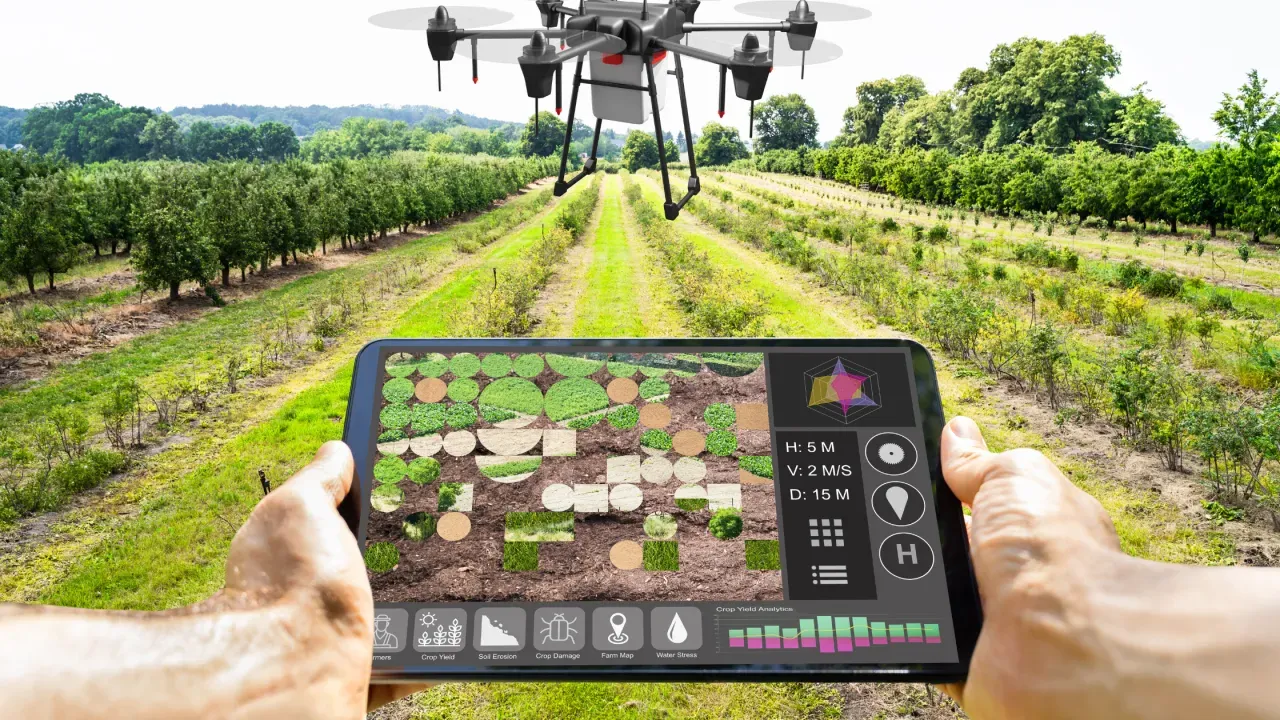
Table of Contents
- Introduction
- Understanding Dataset
- Data Visualization
- Data Preprocessing
- Models
- Conclusion
- Frequently Asked Questions
Introduction
In order to maximize crop output and increase productivity, modern agriculture is depending more and more on data-driven techniques. We explore the world of agricultural data with crop yield forecasting. Our goal is to obtain information that farmers and other agricultural stakeholders can use to make informed decisions by using machine learning models and statistical analysis.
At Labellerr, our cutting-edge SaaS data annotation platform annotates and process complex agricultural datasets to train accurate machine learning models. Start optimizing your farming decisions today—sign up for a free trial.
We'll look at data processing, model building, training, and deployment throughout this book. This tutorial gives readers the tools to understand how computer vision can revolutionize farming practices by offering a hands-on approach.
Understanding Dataset
1. Data Loading and Preprocessing
Examining the dataset, which includes insightful data on crop productivity, environmental conditions, and agricultural practices, is the first section's task. The dataset is loaded and examined using the Pandas package.
import pandas as pd
import matplotlib.pyplot as plt
import numpy as np
import seaborn as sns
df = pd.read_csv('/kaggle/input/crop-yield-prediction-dataset/yield_df.csv')
df.drop(['Unnamed: 0'], axis=1 , inplace=True)
df.head()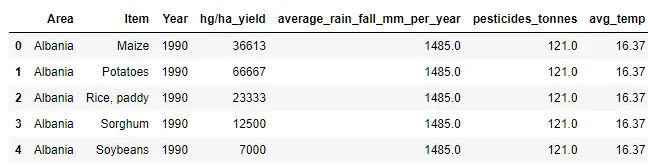
2.Descriptive Statistics
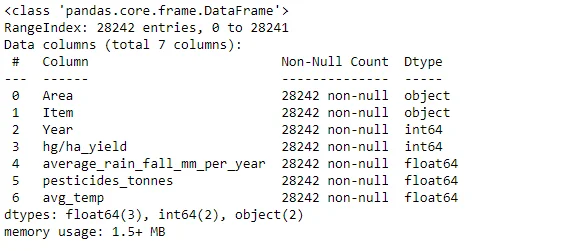
Basic descriptive statistics, such as data shape, information about columns, and summary statistics, provide an overview of the dataset's characteristics.
df.shape

df.info()
df.describe()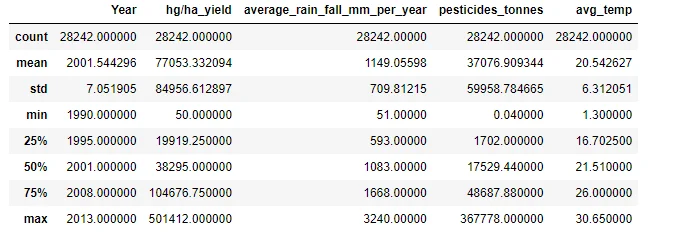
3.Identifying Unique Entities
We investigate unique entities within the dataset, such as unique areas, crop items, and years, to understand the diversity and scope of the data.
df['Area'].nunique()
df['Item'].nunique()
df['Year'].unique() 
4.Analyzing Production Rates
The code identifies the highest and lowest production rates, explores areas with the highest and lowest production rates, and determines the most and least productive crops.
# The highest and the lowest production rate
df['hg/ha_yield'].agg([np.max , np.min])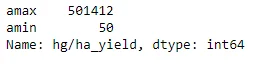
# Area with highest production rate
df[df['hg/ha_yield'] == df['hg/ha_yield'].max() ]['Area']
# Area with lowest production rate
df[df['hg/ha_yield'] == df['hg/ha_yield'].min() ] ['Area'] 
# Year with highest production rate
df[df['hg/ha_yield'] == df['hg/ha_yield'].max() ]['Year']
# Year with lowest production rate
df[df['hg/ha_yield'] == df['hg/ha_yield'].min() ] ['Year']

5.Environmental Factors
Exploration extends to environmental factors such as temperature and rainfall. The code identifies areas with the highest and lowest temperatures and explores the correlation between temperature, rainfall, and crop yield.
# Area with highest Temperature
#df[df['avg_temp'] == df['avg_temp'].max()]
df.groupby('Area')['avg_temp'].max().sort_values(ascending = False).head(1)
# Area with lowest Temperature
#df[df['avg_temp'] == df['avg_temp'].min()]
df.groupby('Area')['avg_temp'].max().sort_values(ascending = True).head(1)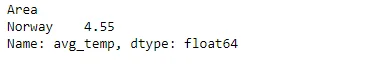
# The most productive crop
df[df['hg/ha_yield'] == df['hg/ha_yield'].max() ]['Item']
# The least productive crop
df[df['hg/ha_yield'] == df['hg/ha_yield'].min() ]['Item']
# Area with highest rainfall
#df[df['average_rain_fall_mm_per_year'] == df['average_rain_fall_mm_per_year'].max()]
df.groupby('Area')['average_rain_fall_mm_per_year'].max().sort_values(ascending = False).head(1)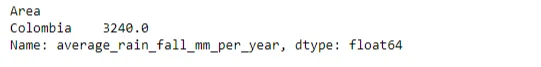
# Area with lowest rainfall
#df[df['average_rain_fall_mm_per_year'] == df['average_rain_fall_mm_per_year'].min()]
df.groupby('Area')['average_rain_fall_mm_per_year'].min().sort_values(ascending = True).head(1)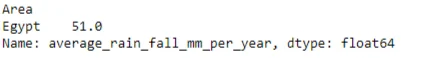
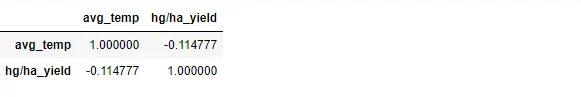
df_temp_prod = df[['avg_temp' , 'hg/ha_yield']]
df_temp_prod.corr(method = 'pearson')
Data Visualization
Correlation Analysis:
The relationship between temperature and crop yield, as well as rainfall and crop yield, is visually represented using scatter plots. Correlation coefficients are computed to quantify the strength of these relationships.
plt.scatter(x= 'avg_temp' , y= 'hg/ha_yield' , data = df)
plt.show()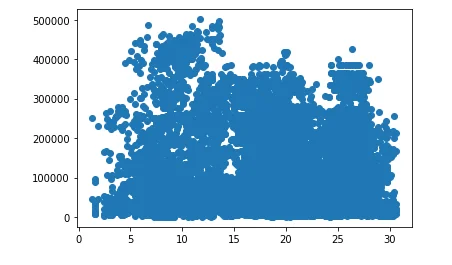
df_rain_prod = df[['average_rain_fall_mm_per_year' , 'hg/ha_yield']]
df_rain_prod.corr(method = 'pearson')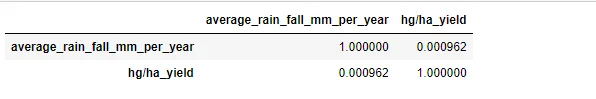
plt.scatter(x = 'average_rain_fall_mm_per_year' , y= 'hg/ha_yield' , data = df)
plt.show()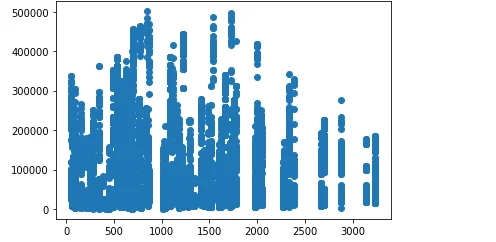
Histograms
Histograms are employed to visualize the distribution of crop yield, average rainfall, and pesticide usage across the dataset.
df['hg/ha_yield'].hist()
plt.show()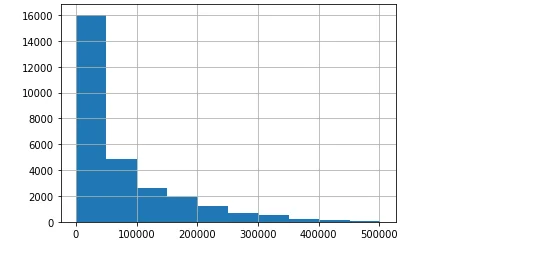
df['avg_temp'].hist()
plt.show()
df['average_rain_fall_mm_per_year'].hist()
plt.show()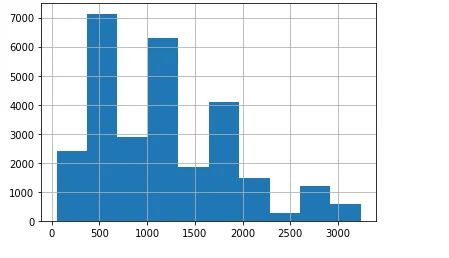
df['pesticides_tonnes'].hist()
plt.show()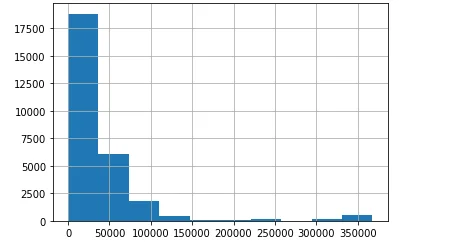
Pie Charts
The code generates pie charts to highlight the distribution of crop yield across the top areas and the most produced crop items.
df['Area'].value_counts()[:3].plot(kind='pie')
plt.show()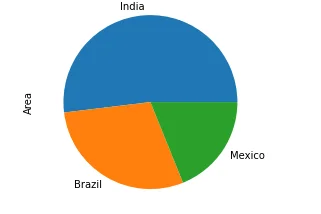
df['Item'].value_counts()[:5].plot(kind='pie')
plt.show()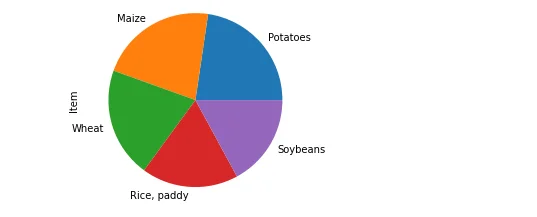
Heatmap
A heatmap is utilized to visualize the correlation matrix, providing insights into the relationships between different variables in the dataset.
sns.heatmap(df.corr())
plt.show()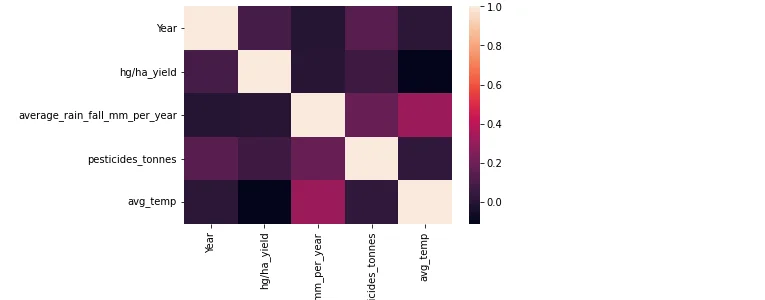
Data Preprocessing
One-Hot Encoding
Categorical variables such as 'Area' and 'Item' are one-hot encoded to prepare the data for machine learning models.
df_ohe = pd.get_dummies(df, columns=['Area',"Item"])
df_ohe.head()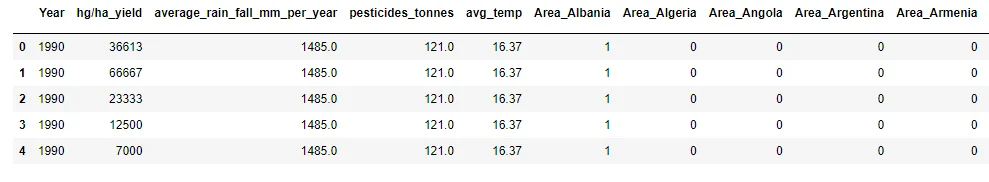
Standardization
Numeric features like 'Year,' 'average_rain_fall_mm_per_year,' 'pesticides_tonnes,' and 'avg_temp' are standardized using the StandardScaler to ensure consistent scaling.
from sklearn.preprocessing import StandardScaler
sc = StandardScaler()
cols = ['Year','average_rain_fall_mm_per_year','pesticides_tonnes','avg_temp']
df_ohe[cols]= sc.fit_transform(df_ohe[cols])
df_ohe.head()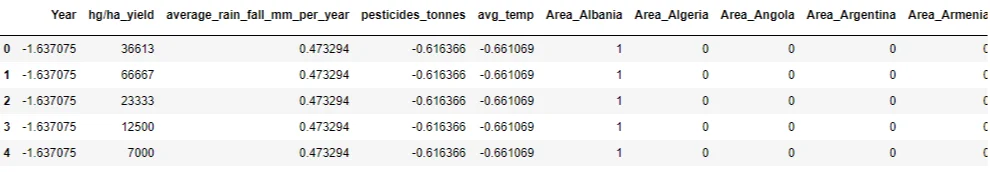
y = df_ohe['hg/ha_yield']
X= df_ohe.drop('hg/ha_yield',axis=1)
X.head()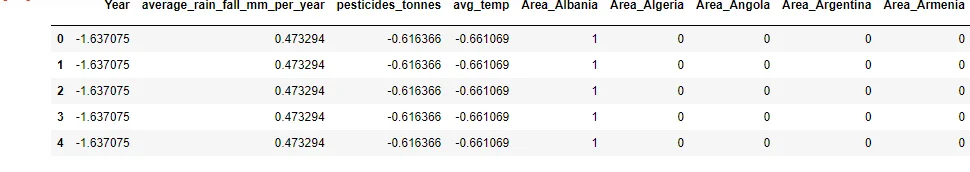
Models
Model Selection
Three machine learning models - Decision Tree Regressor, Gradient Boosting Regressor, and Random Forest Regressor - are chosen for predicting crop yield based on the preprocessed data.
from sklearn.model_selection import train_test_split
x_train , x_test, y_train , y_test = train_test_split(X, y ,test_size=0.3, random_state=42)
from sklearn.ensemble import RandomForestRegressor
from sklearn.ensemble import GradientBoostingRegressor
from sklearn.tree import DecisionTreeRegressor
from sklearn.metrics import r2_scoreModel Evaluation
R-squared scores are calculated to evaluate the performance of each model, providing insights into their predictive capabilities.
dt = DecisionTreeRegressor()
dt.fit(x_train , y_train)
y_pred = dt.predict(x_test)
score = r2_score(y_test,y_pred)
score
gbr=GradientBoostingRegressor(n_estimators=300, max_depth=5, random_state=0)
gbr.fit(x_train , y_train)
y_pred = gbr.predict(x_test)
score = r2_score(y_test,y_pred)
score
rf =RandomForestRegressor(n_estimators=300, max_depth=5, random_state=0)
rf.fit(x_train , y_train)
y_pred = rf.predict(x_test)
score = r2_score(y_test,y_pred)
score
Conclusion
Through statistical analysis and machine learning, we have investigated crop distribution, production rates, and environmental factors, paving the way for informed decision-making in the pursuit of agricultural productivity. These discoveries have been made possible by delving into the complexities of the crop yield prediction dataset.
Frequently Asked Questions
1.What is crop yield prediction using data analytics?
In the agricultural sector, crop production prediction is a crucial predictive analytics method. It is a farming technique that can assist farmers and farming enterprises in forecasting crop yield in a given season, as well as when to plant and harvest crops to maximize yield.
2.Which algorithm is best for crop yield prediction?
A more sophisticated kind of machine learning algorithm that mimics the composition and operations of the human brain is called an artificial neural network. They are especially well equipped to anticipate agricultural yields because of their capacity to process massive volumes of data and recognize intricate patterns and linkages.
3.What predicts agricultural yields based on?
The most often used parameters are soil type, rainfall, and temperature. The ML algorithm that is most frequently used is neural networks. CNN is the deep learning algorithm that is most frequently employed.
4.What is yield and productivity in agriculture?
While they are not the same thing, yields and agricultural productivity are related. Yields are determined by the weight of the crop produced per unit of land, whereas agricultural productivity is determined by the amount of money produced per unit of land.

Simplify Your Data Annotation Workflow With Proven Strategies
.png)