
ML Guide To Build PPE Detection Model For Construction Safety
Learn how to build a PPE detection model using YOLOv8 for construction site safety. This step-by-step guide covers dataset preparation, annotation, training, validation, and deployment to identify helmets, masks, vests, vehicles, and safety violations.

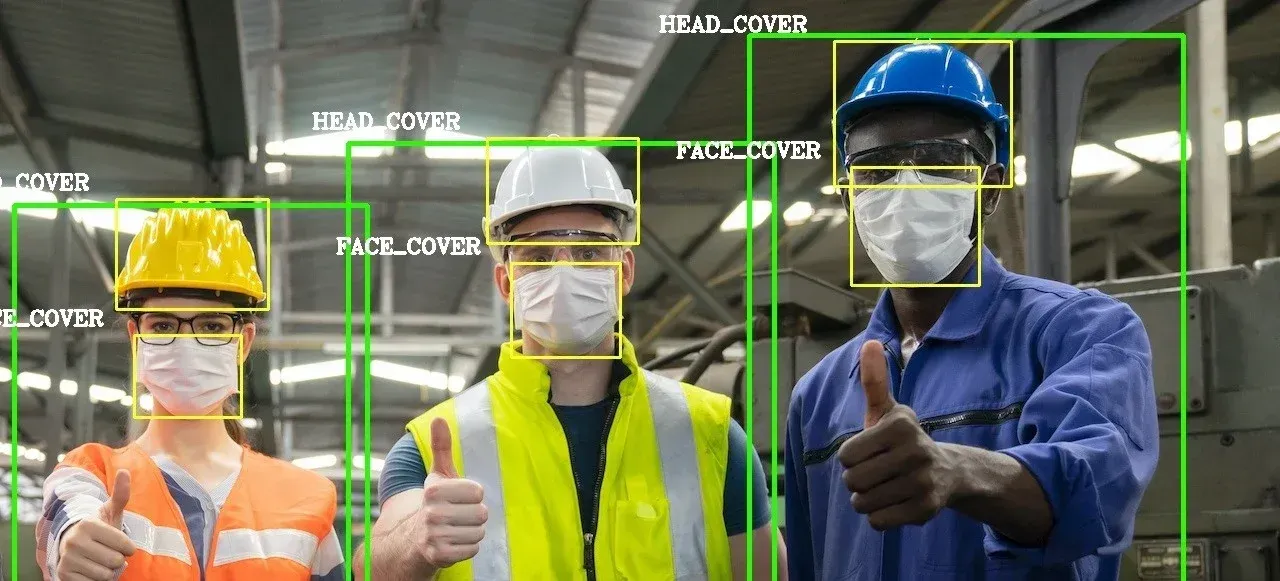
Table of Contents
Introduction
Real-time object identification has emerged as a key component in the dynamic field of computer vision, helping numerous industries to effectively solve safety concerns. Here, we address the topic of construction site safety by utilizing the state-of-the-art YOLOv8 algorithm for PPE (Personal Protective Equipment) detection.
This tutorial is for ML researchers, product managers and data scientist who want to build a quick PPE detection model for construction site safety use case.
We start by investigating the YOLOv8 method, which is well-known for its quickness, effectiveness, and capacity for real-time object recognition. YOLOv8, the most recent version, takes center stage as it demonstrates its mastery of handling unique datasets for specialized purposes.
Enhance safety on construction sites with Labellerr’s advanced annotation solutions, powered by YOLOv8. Train precise models to detect safety risks. Book a demo
About Dataset
Labels in this dataset:
- 0: Hardhat
- 1: Mask
- 2: NO-Hardhat
- 3: NO-Mask
- 4: NO-Safety Vest
- 5: Person
- 6: Safety Cone
- 7: Safety Vest
- 8: Machinery
- 9: Vehicle
More info:
- Number of classes: 10
- Label Annotation: YOLO format (.txt)
[class_id, center_x, center_y, width, height]
Hands-on Tutorial
Here are steps that we'll follow to build our model from scratch.
Outline
1.Importing Libraries and Defining Dataset Paths
2.Configuring Parameters
3.Exploring the Dataset
4.Data Preprocessing and Training Pipeline
5.Pretrained Model Inference
6.Model Training
7.Exporting the Model
8.Analyzing Training Results
9.Validation
Here, we offer a practical beginners' approach for PPE (Personal Protective Equipment) detection using the YOLOv8 algorithm.
1.Importing Libraries and Defining Dataset Paths
The importing of necessary Python libraries lays the groundwork, highlighting the YOLOv8 implementation's elegance and simplicity. The careful definition of dataset pathways makes it possible to integrate construction site safety datasets with ease.
import warnings
warnings.filterwarnings("ignore")

import os
import re
import glob
import random
import yaml

import numpy as np
import pandas as pd
import matplotlib.pyplot as plt
from matplotlib.patches import Rectangle
import seaborn as sns

import IPython.display as display
from PIL import Image
import cv2

from ultralytics import YOLO
! wandb disabled
2.Configuring Parameters
The Configuration (CFG) class defines essential settings, such as classes, training parameters, and dataset paths. YAML files are created to properly format and configure the construction site safety dataset for YOLO.
class CFG:
    DEBUG = False
    FRACTION = 0.05 if DEBUG else 1.0
    SEED = 88

    # classes
    CLASSES = ['Hardhat', 'Mask', 'NO-Hardhat', 'NO-Mask',
               'NO-Safety Vest', 'Person', 'Safety Cone',
               'Safety Vest', 'machinery', 'vehicle']
    NUM_CLASSES_TO_TRAIN = len(CLASSES)

    # training
    EPOCHS = 3 if DEBUG else 100
    BATCH_SIZE = 16

    BASE_MODEL = 'yolov8x' # yolov8n, yolov8s, yolov8m, yolov8l, yolov8x
    BASE_MODEL_WEIGHTS = f'{BASE_MODEL}.pt'
    EXP_NAME = f'ppe_css_{EPOCHS}_epochs'

    OPTIMIZER = 'auto' # SGD, Adam, Adamax, AdamW, NAdam, RAdam, RMSProp, auto
    LR = 1e-3
    LR_FACTOR = 0.01
    WEIGHT_DECAY = 5e-4
    DROPOUT = 0.0
    PATIENCE = 20
    PROFILE = False
    LABEL_SMOOTHING = 0.0

    # paths
    CUSTOM_DATASET_DIR = '/kaggle/input/construction-site-safety-image-dataset-
    roboflow/css-data/'
    OUTPUT_DIR = './'
dict_file = {
'train': os.path.join(CFG.CUSTOM_DATASET_DIR, 'train'),
'val': os.path.join(CFG.CUSTOM_DATASET_DIR, 'valid'),
'test': os.path.join(CFG.CUSTOM_DATASET_DIR, 'test'),
'nc': CFG.NUM_CLASSES_TO_TRAIN,
'names': CFG.CLASSES
}
with open(os.path.join(CFG.OUTPUT_DIR, 'data.yaml'), 'w+') as file:
yaml.dump(dict_file, file)### read yaml file created
def read_yaml_file(file_path = CFG.CUSTOM_DATASET_DIR):
with open(file_path, 'r') as file:
try:
data = yaml.safe_load(file)
return data
except yaml.YAMLError as e:
print("Error reading YAML:", e)
return None
### print it with newlines
def print_yaml_data(data):
formatted_yaml = yaml.dump(data, default_style=False)
print(formatted_yaml)
file_path = os.path.join(CFG.OUTPUT_DIR, 'data.yaml')
yaml_data = read_yaml_file(file_path)
if yaml_data:
print_yaml_data(yaml_data)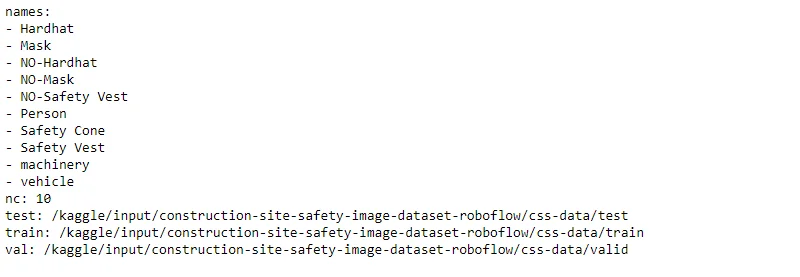
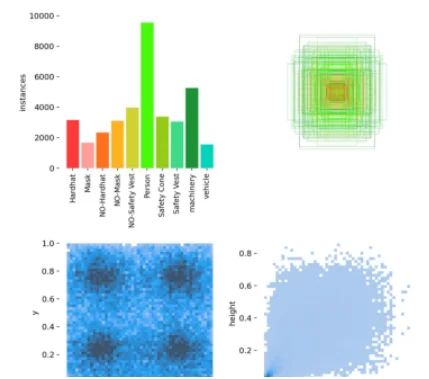
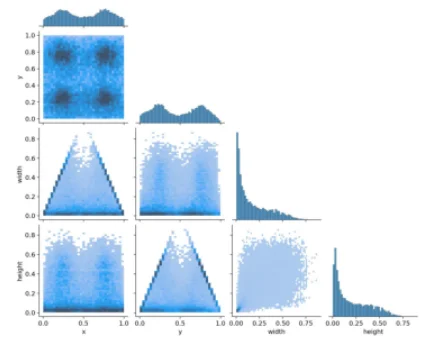
3.Exploring the Dataset
Understanding the dataset is crucial for model training. The blog introduces functions to visualize individual and multiple images from the dataset. It covers image properties, such as dimensions and channels, providing insights into the dataset's characteristics. Statistical analyses reveal class distributions across training, validation, and test sets, laying the foundation for model training.
def display_image(image, print_info = True, hide_axis = False):
    if isinstance(image, str):  # Check if it's a file path
        img = Image.open(image)
        plt.imshow(img)
    elif isinstance(image, np.ndarray):  # Check if it's a NumPy array
        image = image[..., ::-1]  # BGR to RGB
        img = Image.fromarray(image)
        plt.imshow(img)
    else:
        raise ValueError("Unsupported image format")

    if print_info:
        print('Type: ', type(img), '\n')
        print('Shape: ', np.array(img).shape, '\n')

    if hide_axis:
        plt.axis('off')

    plt.show()
example_image_path = '/kaggle/input/construction-site-safety-image-dataset-
roboflow/css-data/train/images/-2297-
_png_jpg.rf.9fff3740d864fbec9cda50d783ad805e.jpg'
display_image(example_image_path, print_info = True, hide_axis = False)
def plot_random_images_from_folder(folder_path, num_images=20, seed=CFG.SEED):

    random.seed(seed)

    # Get a list of image files in the folder
    image_files = [f for f in os.listdir(folder_path) if f.endswith(('.jpg',
    '.png', '.jpeg', '.gif'))]

    # Ensure that we have at least num_images files to choose from
    if len(image_files) < num_images:
        raise ValueError("Not enough images in the folder")

    # Randomly select num_images image files
    selected_files = random.sample(image_files, num_images)

    # Create a subplot grid
    num_cols = 5
    num_rows = (num_images + num_cols - 1) // num_cols
    fig, axes = plt.subplots(num_rows, num_cols, figsize=(12, 8))

    for i, file_name in enumerate(selected_files):
        # Open and display the image using PIL
        img = Image.open(os.path.join(folder_path, file_name))

        if num_rows == 1:
            ax = axes[i % num_cols]
        else:
            ax = axes[i // num_cols, i % num_cols]

        ax.imshow(img)
        ax.axis('off')
        # ax.set_title(file_name)

    # Remove empty subplots
    for i in range(num_images, num_rows * num_cols):
        if num_rows == 1:
            fig.delaxes(axes[i % num_cols])
        else:
            fig.delaxes(axes[i // num_cols, i % num_cols])

    plt.tight_layout()
    plt.show()
folder_path = CFG.CUSTOM_DATASET_DIR + 'train/images/'
plot_random_images_from_folder(folder_path, num_images=20, seed=CFG.SEED)
# plot_random_images_from_folder(folder_path, num_images=20, seed=54)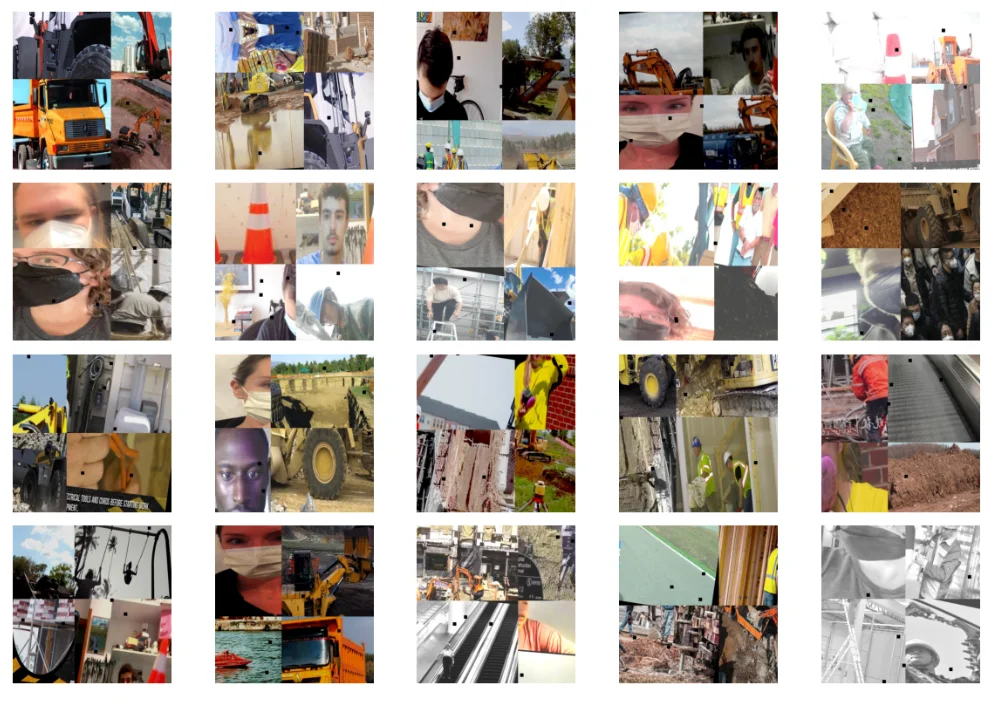
4.Data Preprocessing and Training Pipeline
Constants are determined and the training dataset pipeline is built up as we get ready for the training journey. A peek at class titles provides context for the upcoming model training.
def get_image_properties(image_path):
    # Read the image file
    img = cv2.imread(image_path)

    # Check if the image file is read successfully
    if img is None:
        raise ValueError("Could not read image file")

    # Get image properties
    properties = {
        "width": img.shape[1],
        "height": img.shape[0],
        "channels": img.shape[2] if len(img.shape) == 3 else 1,
        "dtype": img.dtype,
    }

    return properties
img_properties = get_image_properties(example_image_path)
img_properties
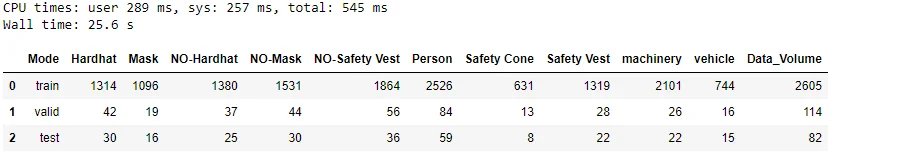
%%time
class_idx = {str(i): CFG.CLASSES[i] for i in range(CFG.NUM_CLASSES_TO_TRAIN)}

class_stat = {}
data_len = {}
class_info = []

for mode in ['train', 'valid', 'test']:
    class_count = {CFG.CLASSES[i]: 0 for i in range(CFG.NUM_CLASSES_TO_TRAIN)}

    path = os.path.join(CFG.CUSTOM_DATASET_DIR, mode, 'labels')

    for file in os.listdir(path):
        with open(os.path.join(path, file)) as f:
            lines = f.readlines()

            for cls in set([line[0] for line in lines]):
                class_count[class_idx[cls]] += 1

    data_len[mode] = len(os.listdir(path))
    class_stat[mode] = class_count

    class_info.append({'Mode': mode, **class_count, 'Data_Volume': data_len[mode]})

dataset_stats_df = pd.DataFrame(class_info)
dataset_stats_df
# Create subplots with 1 row and 3 columns
fig, axes = plt.subplots(1, 3, figsize=(15, 5))

# Plot vertical bar plots for each mode in subplots
for i, mode in enumerate(['train', 'valid', 'test']):
    sns.barplot(
        data=dataset_stats_df[dataset_stats_df['Mode'] == mode].drop(columns='Mode'),
        orient='v',
        ax=axes[i],
        palette='Set2'
    )

    axes[i].set_title(f'{mode.capitalize()} Class Statistics')
    axes[i].set_xlabel('Classes')
    axes[i].set_ylabel('Count')
    axes[i].tick_params(axis='x', rotation=90)

    # Add annotations on top of each bar
    for p in axes[i].patches:
        axes[i].annotate(f"{int(p.get_height())}", (p.get_x() + p.get_width() / 2.,
        p.get_height()),
                         ha='center', va='center', fontsize=8, color='black', xytext=(0, 5),
                         textcoords='offset points')

plt.tight_layout()
plt.show()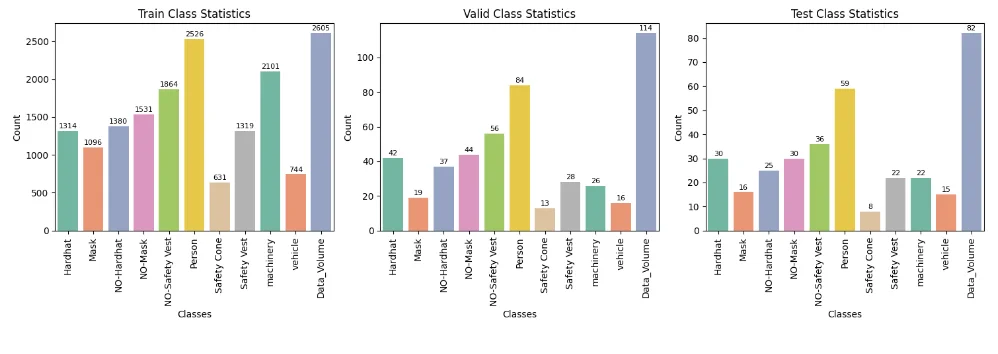
%%time

for mode in ['train', 'valid', 'test']:
    print(f'\nImage sizes in {mode} set:')

    img_size = 0
    for file in glob.glob(os.path.join(CFG.CUSTOM_DATASET_DIR, mode, 'images', '*')):

        image = Image.open(file)

        if image.size != img_size:
            print(f'{image.size}')
            img_size = image.size
            print('\n')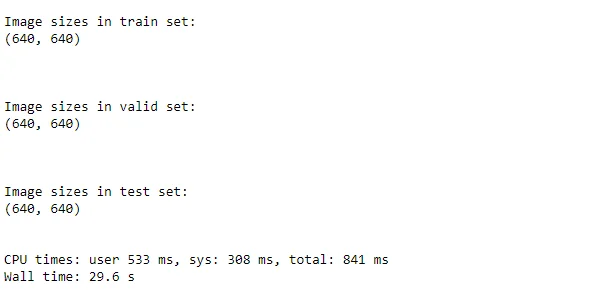
5.Pretrained Model Inference
To showcase the power of YOLOv8, the blog demonstrates pretrained model inference on an example image. The model accurately detects safety-related objects, underscoring its ability to enhance site safety through real-time object detection.
CFG.BASE_MODEL_WEIGHTS

model = YOLO(CFG.BASE_MODEL_WEIGHTS)

results = model.predict(
    source = example_image_path,

    classes = [0],
    conf = 0.30,
    device = [0,1], # inference with dual GPU
    imgsz = (img_properties['height'], img_properties['width']),

    save = True,
    save_txt = True,
    save_conf = True,
    exist_ok = True,
)
### check predictions with base model
example_image_inference_output = example_image_path.split('/')[-1]
display_image(f'/kaggle/working/runs/detect/predict/{example_image_inference_output}')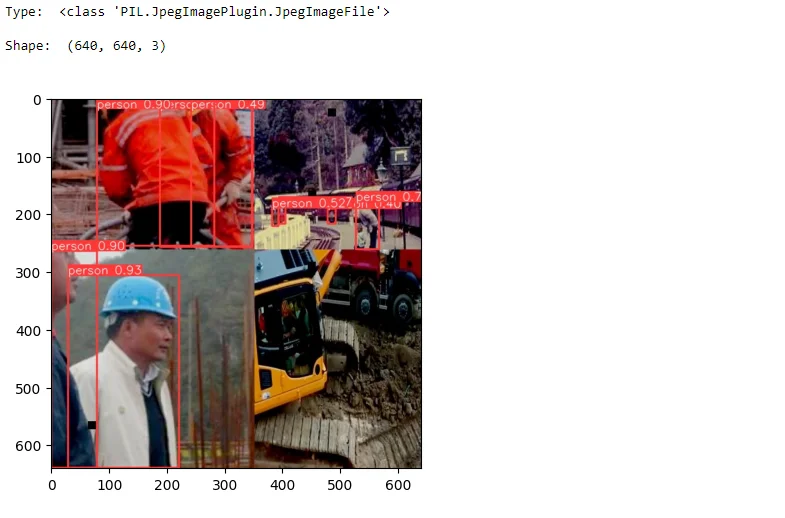
6.Model Training
The training process is detailed, starting with the setup of the YOLOv8 model. Training arguments, including image size, batch size, and optimization parameters, are configured. The blog then explores the training itself, highlighting key metrics and visualizing training and validation losses. Training results, including the best training and validation losses and corresponding epochs, are presented for comprehensive evaluation.
print('Model: ', CFG.BASE_MODEL_WEIGHTS)
print('Epochs: ', CFG.EPOCHS)
print('Batch: ', CFG.BATCH_SIZE)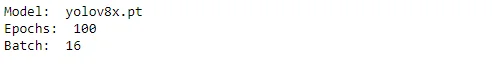
### Load pre-trained YOLO model
model = YOLO(CFG.BASE_MODEL_WEIGHTS)
%%time
### train
model.train(
data = os.path.join(CFG.OUTPUT_DIR, 'data.yaml'),
task = 'detect',
imgsz = (img_properties['height'], img_properties['width']),
epochs = CFG.EPOCHS,
batch = CFG.BATCH_SIZE,
optimizer = CFG.OPTIMIZER,
lr0 = CFG.LR,
lrf = CFG.LR_FACTOR,
weight_decay = CFG.WEIGHT_DECAY,
dropout = CFG.DROPOUT,
fraction = CFG.FRACTION,
patience = CFG.PATIENCE,
profile = CFG.PROFILE,
label_smoothing = CFG.LABEL_SMOOTHING,
name = f'{CFG.BASE_MODEL}_{CFG.EXP_NAME}',
seed = CFG.SEED,
val = True,
amp = True,
exist_ok = True,
resume = False,
device = 0,
verbose = False,
)
7.Exporting the Model
For deployment, the blog guides readers through the export process. The YOLOv8 model is exported to various formats, such as OpenVINO, ONNX, and TensorFlow Lite. This step ensures seamless integration into production environments, allowing for real-world application.
img_properties
# Export the model
model.export(
    format = 'openvino', # openvino, onnx, engine, tflite
    imgsz = (img_properties['height'], img_properties['width']),
    half = False,
    int8 = False,
    simplify = False,
    nms = False,
)
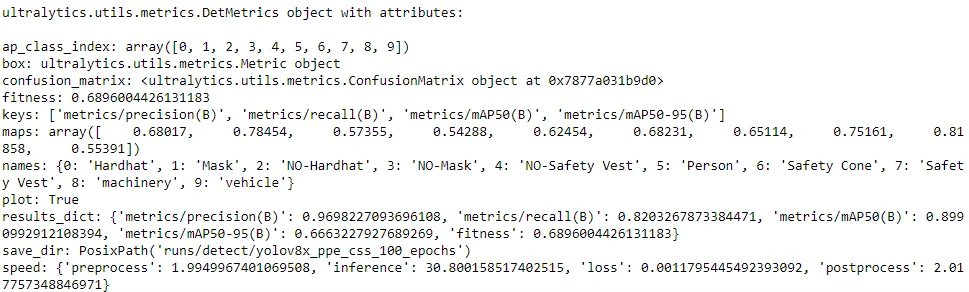
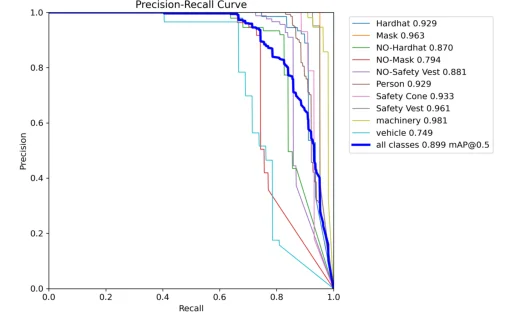
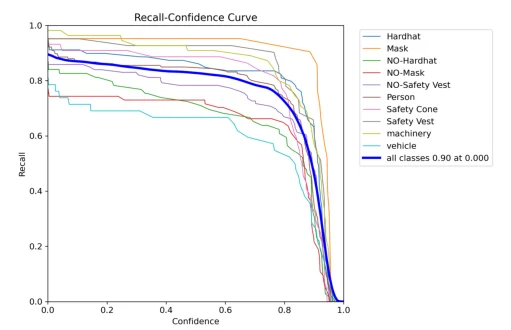
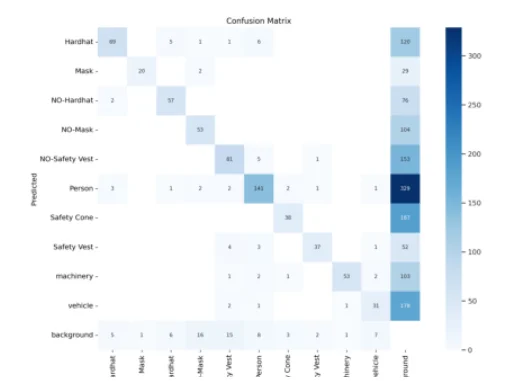
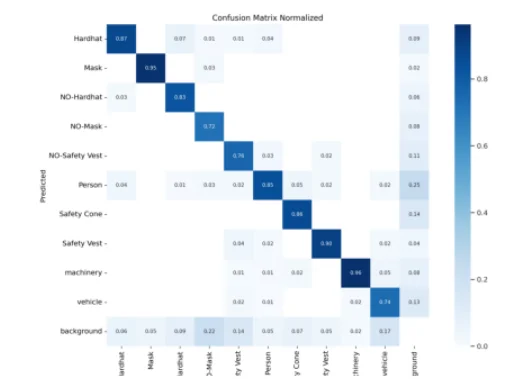
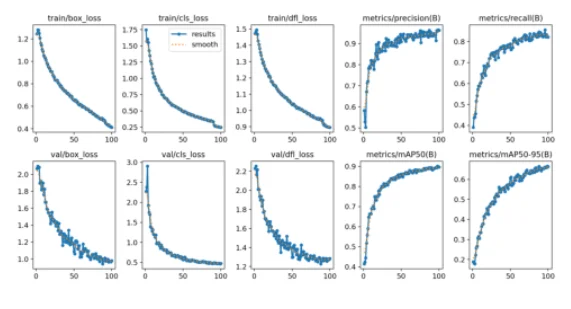
8.Analyzing Training Results
A thorough analysis of training results is provided, including visualizations of detected objects in the validation set. The blog offers insights into the model's performance throughout the training process, enabling readers to assess the effectiveness of the YOLOv8 model for construction site safety.
results_paths = [
    i for i in
    glob.glob(f'{CFG.OUTPUT_DIR}runs/detect/{CFG.BASE_MODEL}_{CFG.EXP_NAME}/*.png') +
    glob.glob(f'{CFG.OUTPUT_DIR}runs/detect/{CFG.BASE_MODEL}_{CFG.EXP_NAME}/*.jpg')
    if 'batch' not in i
]

results_paths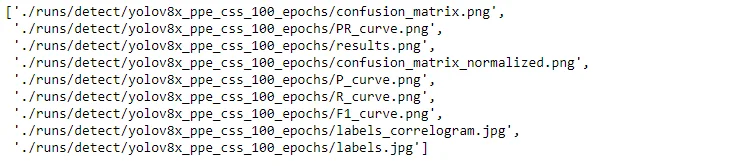
for file in sorted(results_paths):
    print(file)
    display_image(file, print_info = False, hide_axis = True)
    print('\n')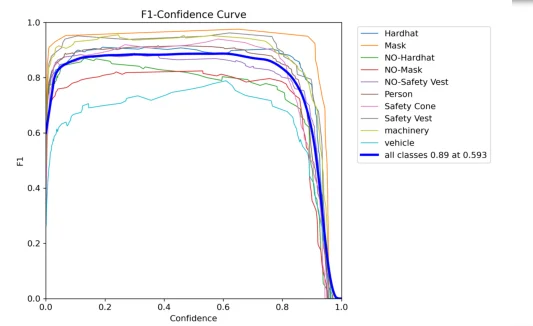
df = pd.read_csv(f'{CFG.OUTPUT_DIR}runs/detect/{CFG.BASE_MODEL}_{CFG.EXP_NAME}/results.csv')
df = df.rename(columns=lambda x: x.replace(" ", ""))
df.to_csv(f'{CFG.OUTPUT_DIR}training_log_df.csv', index=False)
df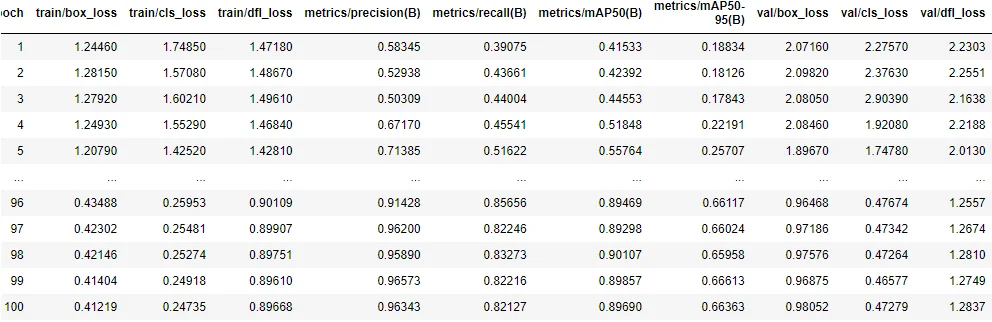
print('*'*50)
print('\nBest Training loss: ', df['train/box_loss'].min(), ', on epoch: ',
df['train/box_loss'].argmin() + 1, '\n')
print('*'*50)
print('\nBest Validation loss: ', df['val/box_loss'].min(), ', on epoch: ',
df['val/box_loss'].argmin() + 1, '\n')
print('*'*50)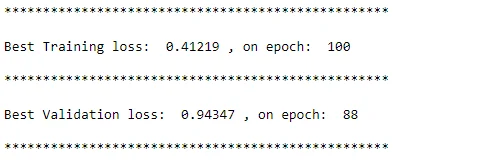
plt.figure(figsize=(10, 6))
plt.plot(df['epoch'], df['train/box_loss'], label='Training Loss', marker='o', linestyle='-')
plt.plot(df['epoch'], df['val/box_loss'], label='Validation Loss', marker='o', linestyle='-')

plt.title('Training and Validation Loss vs. Epochs')
plt.xlabel('Epochs')
plt.ylabel('Loss')
plt.legend()

plt.grid(True)
plt.show()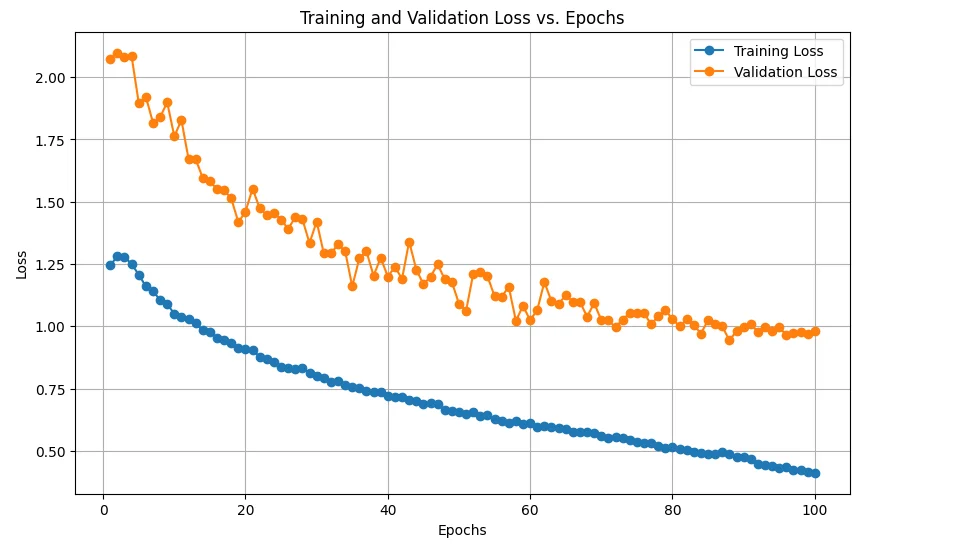
9.Validation
validation_results_paths = [
    i for i in
    glob.glob(f'{CFG.OUTPUT_DIR}runs/detect/{CFG.BASE_MODEL}_{CFG.EXP_NAME}/*.png') +
    glob.glob(f'{CFG.OUTPUT_DIR}runs/detect/{CFG.BASE_MODEL}_{CFG.EXP_NAME}/*.jpg')
    if 'val_batch' in i
]

len(validation_results_paths)
if len(validation_results_paths) >= 1:
    print(validation_results_paths[-1])
### check predictions or labels from a random validation batch
if len(validation_results_paths) >= 1:
val_img_path = random.choice(validation_results_paths)
print(val_img_path)
display_image(val_img_path, print_info = False, hide_axis = True)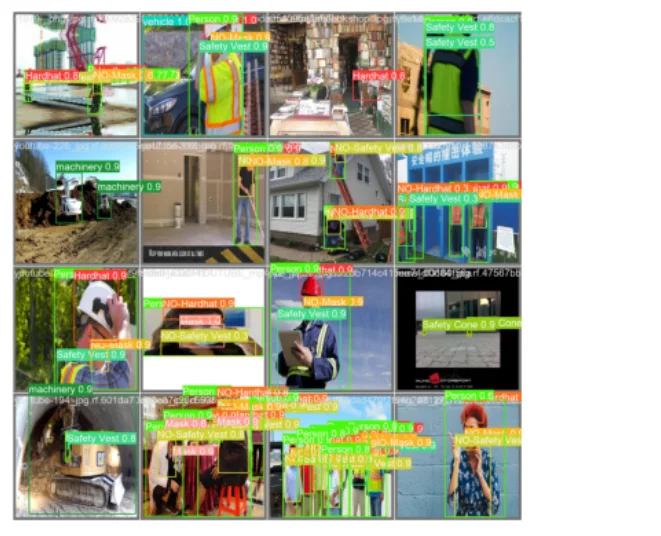
Conclusion
During the preparation, training, and evaluation of a deep learning model, we observed the complex procedures involved in this investigation of YOLOv8-based safety detection on construction sites. Object detection has enormous potential to increase on-site security, particularly in situations where safety is at risk. We expect more developments in the field of computer vision and safety technologies as we get to an end of our adventure.
Frequently Asked Questions
1.How can AI help with safety?
Artificial Intelligence (AI) supports facial recognition and motion detection technologies, which aid security monitoring programmes in identifying workers or unapproved persons who access restricted areas.
A few automation programmes enhance security surveillance's analytical component.
2.Why AI and machine learning in reducing risk in construction industry?
AI systems can predict any safety, quality, and productivity issues and help lower the risk of accidents on construction sites because of their rapid data reception and analysis capabilities.
3.How is AI used in building construction?
Few role of AI in the building industry
1.Enhancing design quality
2.Establish a Safer Workplace
3.Evaluate and Minimise Risk
4.Extends the Project's Duration
5.Strong Daily Automation
Looking for high quality training data to train your PPE detection model? Talk to our team to get a tool demo.

Simplify Your Data Annotation Workflow With Proven Strategies
.png)